Answer:
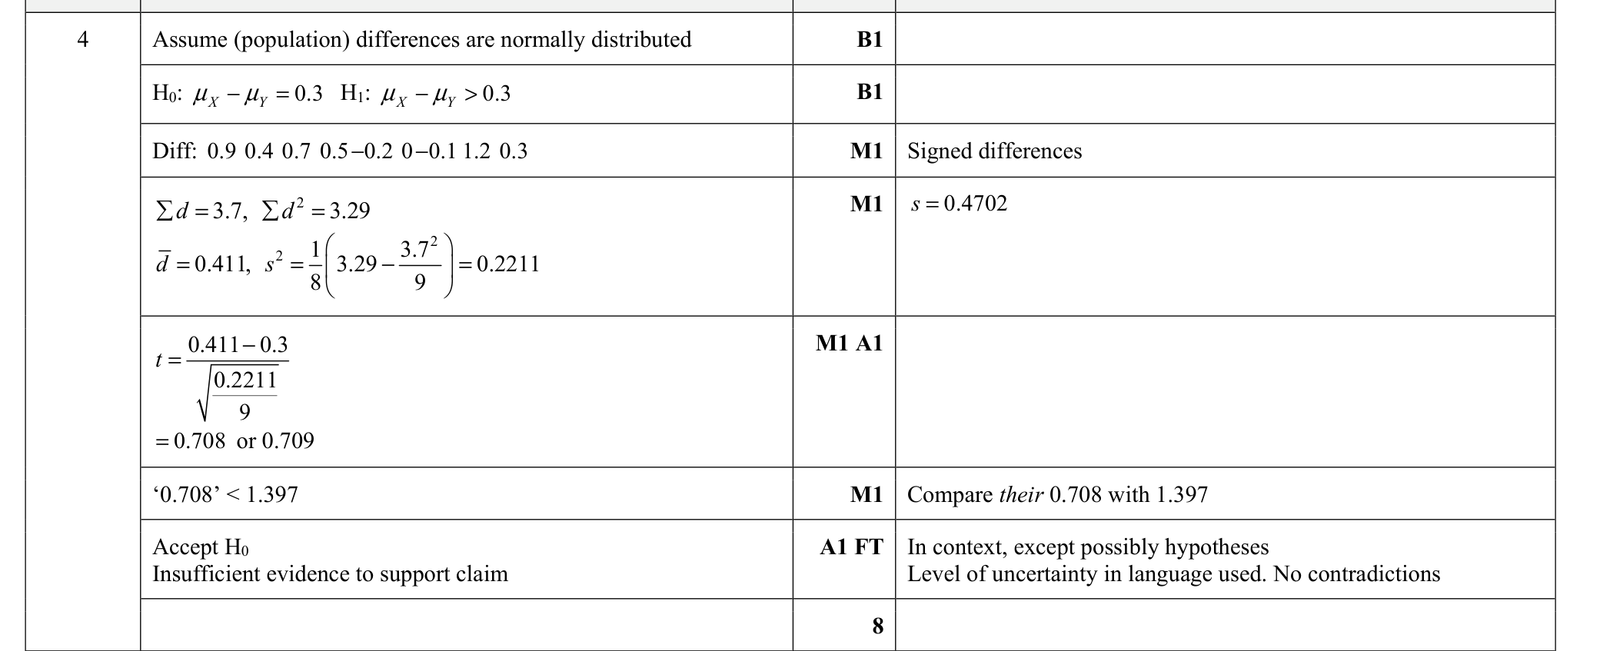
Use a paired t-test with differences defined as
\(d=\text{time before} - \text{time after}\).
The hypotheses are:
\(H_0: \mu_d = 0.3\),
\(H_1: \mu_d \gt 0.3\).
The sample differences are \(0.9, 0.4, 0.7, 0.5, -0.2, 0, -0.1, 1.2, 0.3\).
From these, \(\bar d = 0.411\) and \(s = 0.470\).
So
\(t = \dfrac{0.411-0.3}{0.470/\sqrt{9}} \approx 0.708\), with \(8\) degrees of freedom.
At the \(10\%\) significance level, the one-tailed critical value is \(1.397\). Since \(0.708 \lt 1.397\), we do not reject \(H_0\).
There is insufficient evidence that the mean reduction is at least \(0.3\) s, so the organiser’s claim is not justified.
Assumption: the population of paired differences is normally distributed.
Because each athlete is measured twice, this is a paired sample problem. We test the mean of the differences.
Let
\(d = \text{before} - \text{after}\).
A positive value of \(d\) means the athlete improved.
The organiser claims that the mean reduction is at least \(0.3\) s, so we test
\(H_0: \mu_d = 0.3\),
\(H_1: \mu_d \gt 0.3\).
We assume that the population of differences is normally distributed.
The differences are:
- A: \(48.8-47.9=0.9\)
- B: \(48.2-47.8=0.4\)
- C: \(50.3-49.6=0.7\)
- D: \(49.6-49.1=0.5\)
- E: \(49.4-49.6=-0.2\)
- F: \(48.9-48.9=0\)
- G: \(47.6-47.7=-0.1\)
- H: \(50.3-49.1=1.2\)
- I: \(48.4-48.1=0.3\)
So
\(\sum d = 0.9+0.4+0.7+0.5-0.2+0-0.1+1.2+0.3 = 3.7\)
and
\(\sum d^2 = 0.9^2+0.4^2+0.7^2+0.5^2+(-0.2)^2+0^2+(-0.1)^2+1.2^2+0.3^2 = 3.29\).
With \(n=9\), the sample mean is
\(\bar d = \dfrac{3.7}{9} = 0.411\overline{1}\).
The sample variance is
\(s^2 = \dfrac{1}{n-1}\left(\sum d^2 - \dfrac{(\sum d)^2}{n}\right)\)
\(= \dfrac{1}{8}\left(3.29 - \dfrac{3.7^2}{9}\right)\)
\(= \dfrac{1}{8}(3.29 - 1.5211\overline{1})\)
\(= 0.2211\) approximately.
Hence
\(s = \sqrt{0.2211} \approx 0.4702\).
The test statistic is
\(t = \dfrac{\bar d - 0.3}{s/\sqrt{n}} = \dfrac{0.4111-0.3}{0.4702/\sqrt{9}}\)
\(= \dfrac{0.1111}{0.1567} \approx 0.708\).
This has \(9-1=8\) degrees of freedom.
For a one-tailed test at the \(10\%\) level with \(8\) degrees of freedom, the critical value is \(1.397\).
Since
\(0.708 \lt 1.397\),
the test statistic is not in the critical region, so we do not reject \(H_0\).
Conclusion: there is insufficient evidence at the \(10\%\) significance level to conclude that the mean reduction in time is greater than \(0.3\) s. Therefore the organiser’s claim is not justified.