Answer:
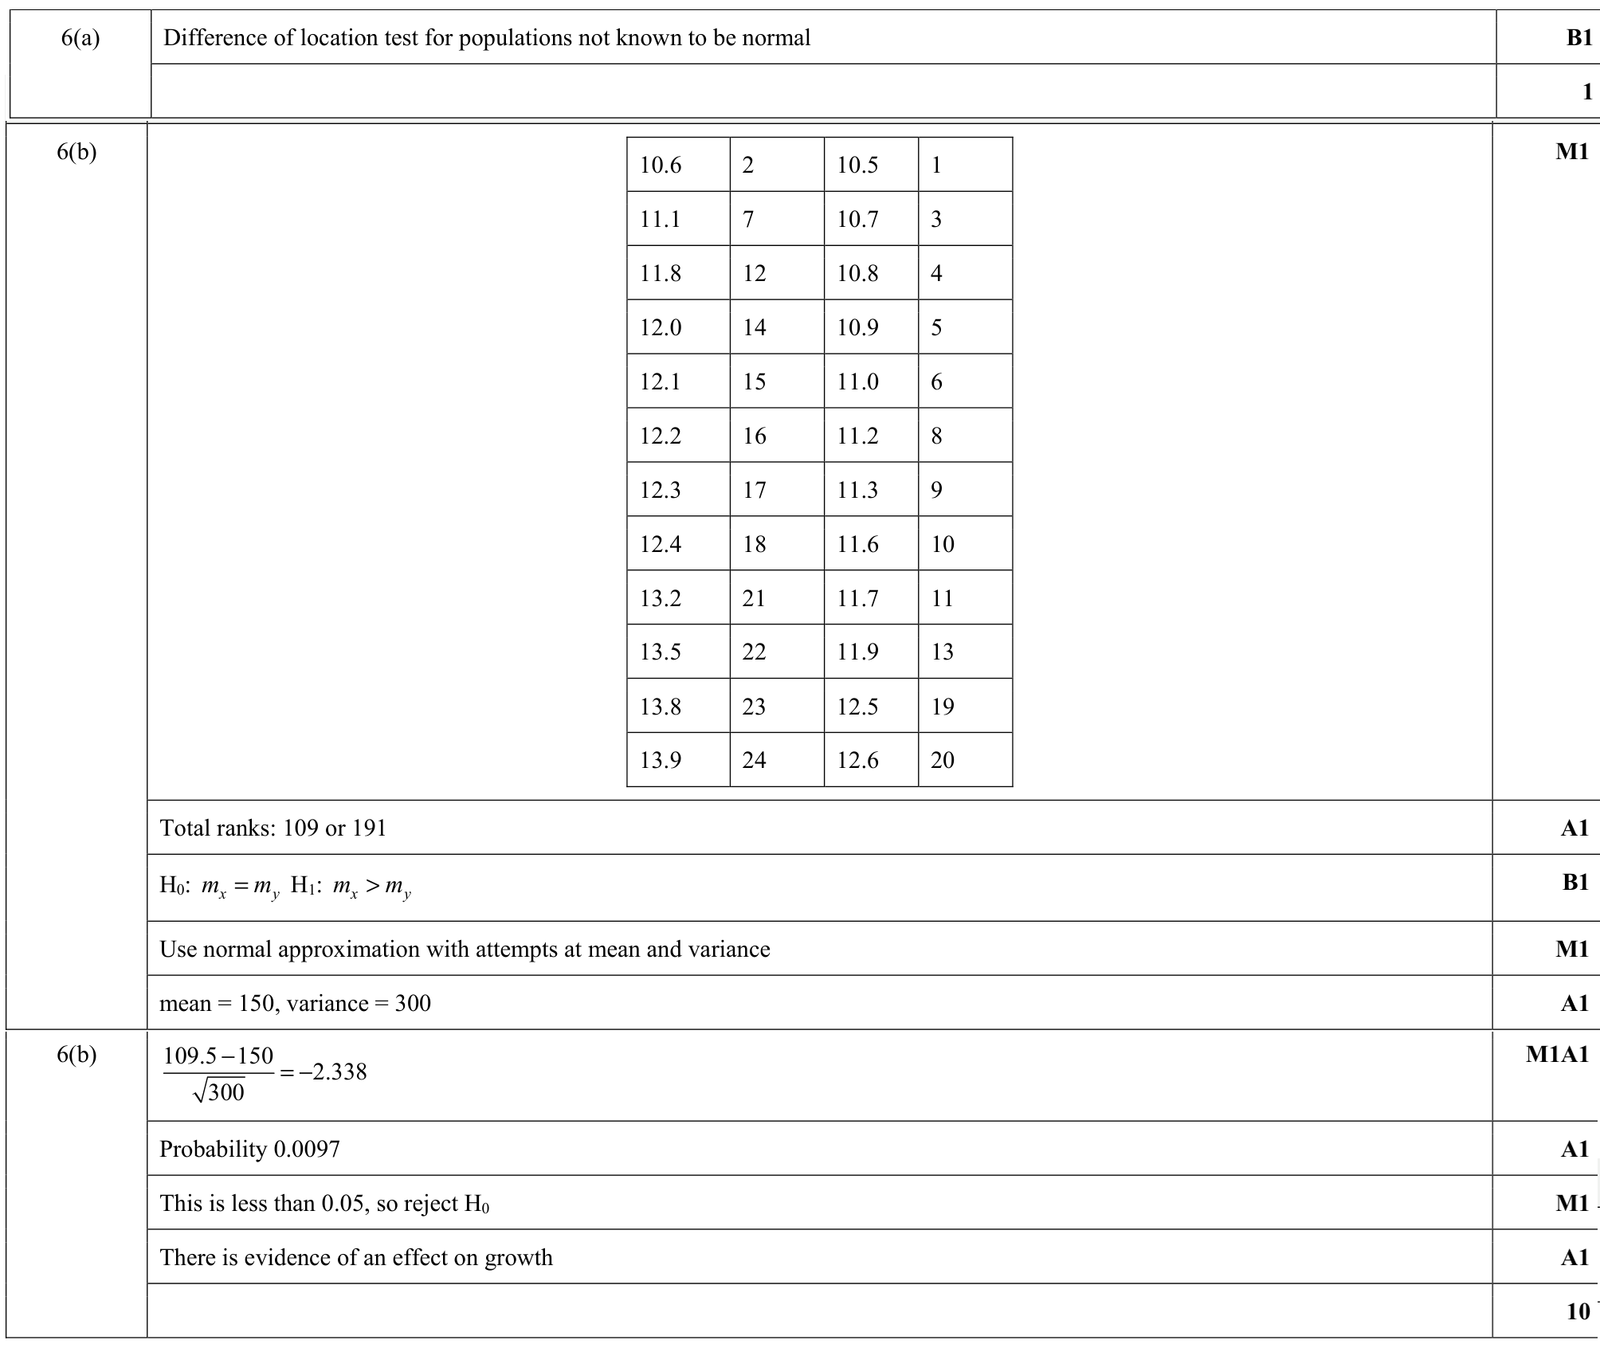
(a) A Wilcoxon rank-sum test is appropriate because it is a test for a difference of location between two independent samples, and the populations are not known to be normal.
(b) Use \(H_0\): the two populations have the same location, against \(H_1\): group \(A\) tends to have greater heights than group \(B\).
The rank sum for group \(B\) is \(109\) and the rank sum for group \(A\) is \(191\).
Using the normal approximation with continuity correction,
\(z=\dfrac{109.5-150}{\sqrt{300}}=-2.338\).
The one-tailed probability is approximately \(0.0097\).
Since \(0.0097\lt0.05\), reject \(H_0\).
There is sufficient evidence at the 5% level that the nutrients have increased growth.
(a) The two samples are independent, and we are testing whether one population tends to give larger values than the other. A Wilcoxon rank-sum test is suitable because it is a non-parametric test for difference in location and does not assume normality.
(b) We test whether the nutrient group has larger heights.
\(H_0\): the two populations have the same location (same median height).
\(H_1\): the population for group \(A\) is shifted to the right of that for group \(B\), so group \(A\) tends to have greater heights.
Rank all 24 observations together from smallest to largest.
| Height | Group | Rank |
|---|
| 10.5 | B | 1 |
| 10.6 | A | 2 |
| 10.7 | B | 3 |
| 10.8 | B | 4 |
| 10.9 | B | 5 |
| 11.0 | B | 6 |
| 11.1 | A | 7 |
| 11.2 | B | 8 |
| 11.3 | B | 9 |
| 11.6 | B | 10 |
| 11.7 | B | 11 |
| 11.8 | A | 12 |
| 11.9 | B | 13 |
| 12.0 | A | 14 |
| 12.1 | A | 15 |
| 12.2 | A | 16 |
| 12.3 | A | 17 |
| 12.4 | A | 18 |
| 12.5 | B | 19 |
| 12.6 | B | 20 |
| 13.2 | A | 21 |
| 13.5 | A | 22 |
| 13.8 | A | 23 |
| 13.9 | A | 24 |
There are no ties, so the ranks are straightforward.
Sum of ranks for group \(B\):
\(1+3+4+5+6+8+9+10+11+13+19+20=109\).
Equivalently, the sum of ranks for group \(A\) is
\(2+7+12+14+15+16+17+18+21+22+23+24=191\),
and \(109+191=300=1+2+\cdots+24\), which checks.
Using the normal approximation for the Wilcoxon rank-sum statistic with a continuity correction, take the smaller rank sum \(W=109\). Then
\(\mu_W=\frac{n_B(n_A+n_B+1)}{2}=\frac{12(25)}{2}=150\),
and
\(\sigma_W=\sqrt{\frac{n_An_B(n_A+n_B+1)}{12}}=\sqrt{\frac{12\cdot12\cdot25}{12}}=\sqrt{300}.\)
Since we are looking at the lower tail for the rank sum of group \(B\), apply a continuity correction:
\(z=\frac{109+0.5-150}{\sqrt{300}}=\frac{109.5-150}{\sqrt{300}}=-2.338\).
So
\(P(Z\le -2.338)\approx 0.0097\).
This probability is less than \(0.05\), so we reject \(H_0\).
There is sufficient evidence to conclude that the plants given nutrients have grown taller, so the nutrients appear to have increased growth.