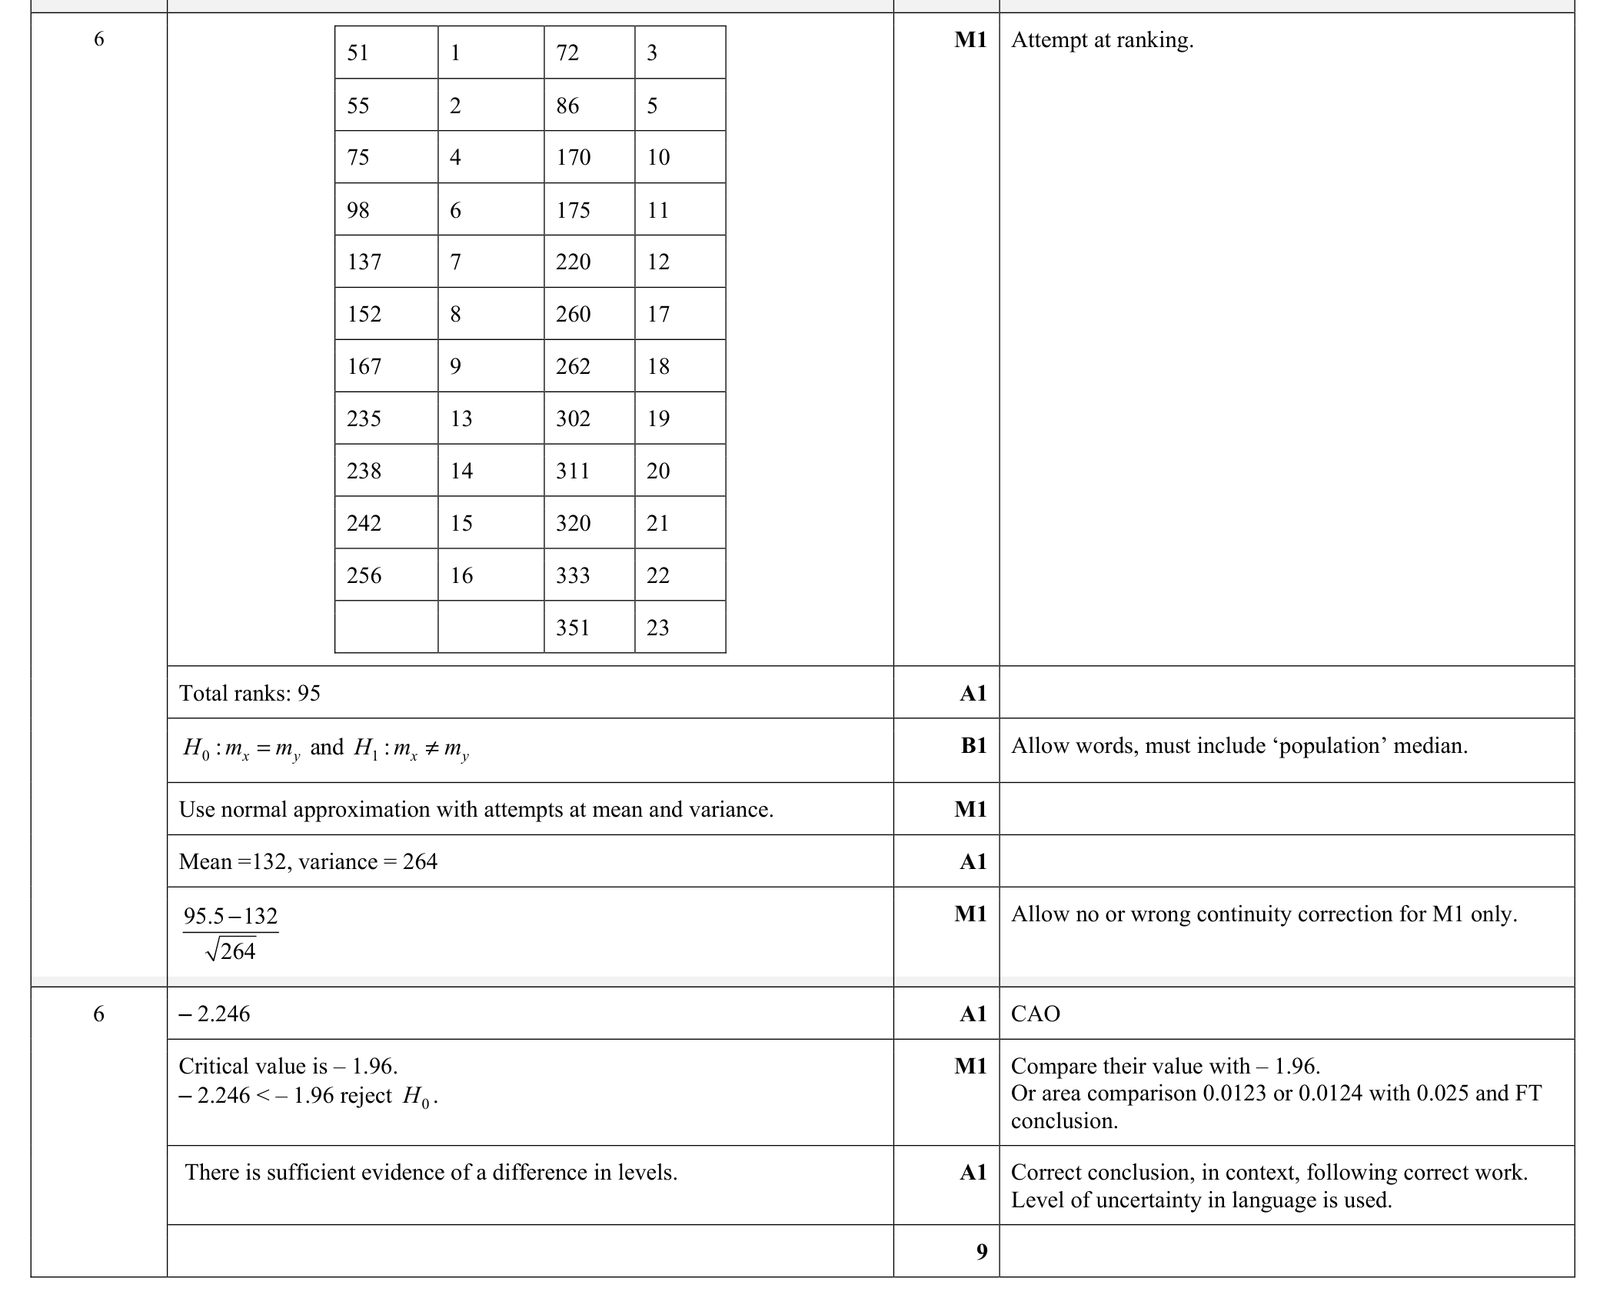
Answer: Using the Wilcoxon rank-sum test with women as the first sample, the sum of the women’s ranks is \(95\).
Under \(H_0\), \(E(R)=132\) and \(\operatorname{Var}(R)=264\).
So, using a continuity correction,
\(z=\frac{95.5-132}{\sqrt{264}}\approx -2.246\).
For a two-tailed test at the \(5\%\) level, the critical values are \(\pm 1.96\).
Since \(-2.246\lt -1.96\), reject \(H_0\).
There is sufficient evidence at the \(5\%\) level that the cholesterol levels of women and men differ.
Let the women’s sample be sample 1, with \(n_1=11\), and the men’s sample be sample 2, with \(n_2=12\).
We test:
\(H_0\): the two populations have the same median cholesterol level.
\(H_1\): the two populations have different median cholesterol levels.
This is a two-sided Wilcoxon rank-sum test.
First combine all 23 observations and rank them from smallest to largest.
| Value | Group | Rank |
|---|
| 51 | Women | 1 |
| 55 | Women | 2 |
| 72 | Men | 3 |
| 75 | Women | 4 |
| 86 | Men | 5 |
| 98 | Women | 6 |
| 137 | Women | 7 |
| 152 | Women | 8 |
| 167 | Women | 9 |
| 170 | Men | 10 |
| 175 | Men | 11 |
| 220 | Men | 12 |
| 235 | Women | 13 |
| 238 | Women | 14 |
| 242 | Women | 15 |
| 256 | Women | 16 |
| 260 | Men | 17 |
| 262 | Men | 18 |
| 302 | Men | 19 |
| 311 | Men | 20 |
| 320 | Men | 21 |
| 333 | Men | 22 |
| 351 | Men | 23 |
There are no tied values.
Sum of ranks for women:
\(R=1+2+4+6+7+8+9+13+14+15+16=95\).
Since both sample sizes are greater than 10, we use the normal approximation.
For the rank sum \(R\), under \(H_0\),
\(\mu_R=\frac{n_1(n_1+n_2+1)}{2}=\frac{11(24)}{2}=132\).
Also,
\(\sigma_R^2=\frac{n_1n_2(n_1+n_2+1)}{12}=\frac{11\times 12\times 24}{12}=264\).
So \(\sigma_R=\sqrt{264}\).
The observed rank sum \(95\) is below the mean \(132\), so with a continuity correction we use \(95.5\):
\(z=\frac{95.5-132}{\sqrt{264}}\approx \frac{-36.5}{16.248}\approx -2.246\).
For a two-tailed test at the \(5\%\) significance level, the critical values are \(\pm 1.96\).
Since \(-2.246\lt -1.96\), the test statistic lies in the critical region, so we reject \(H_0\).
Therefore there is sufficient evidence to conclude that the population median cholesterol levels differ between women and men.