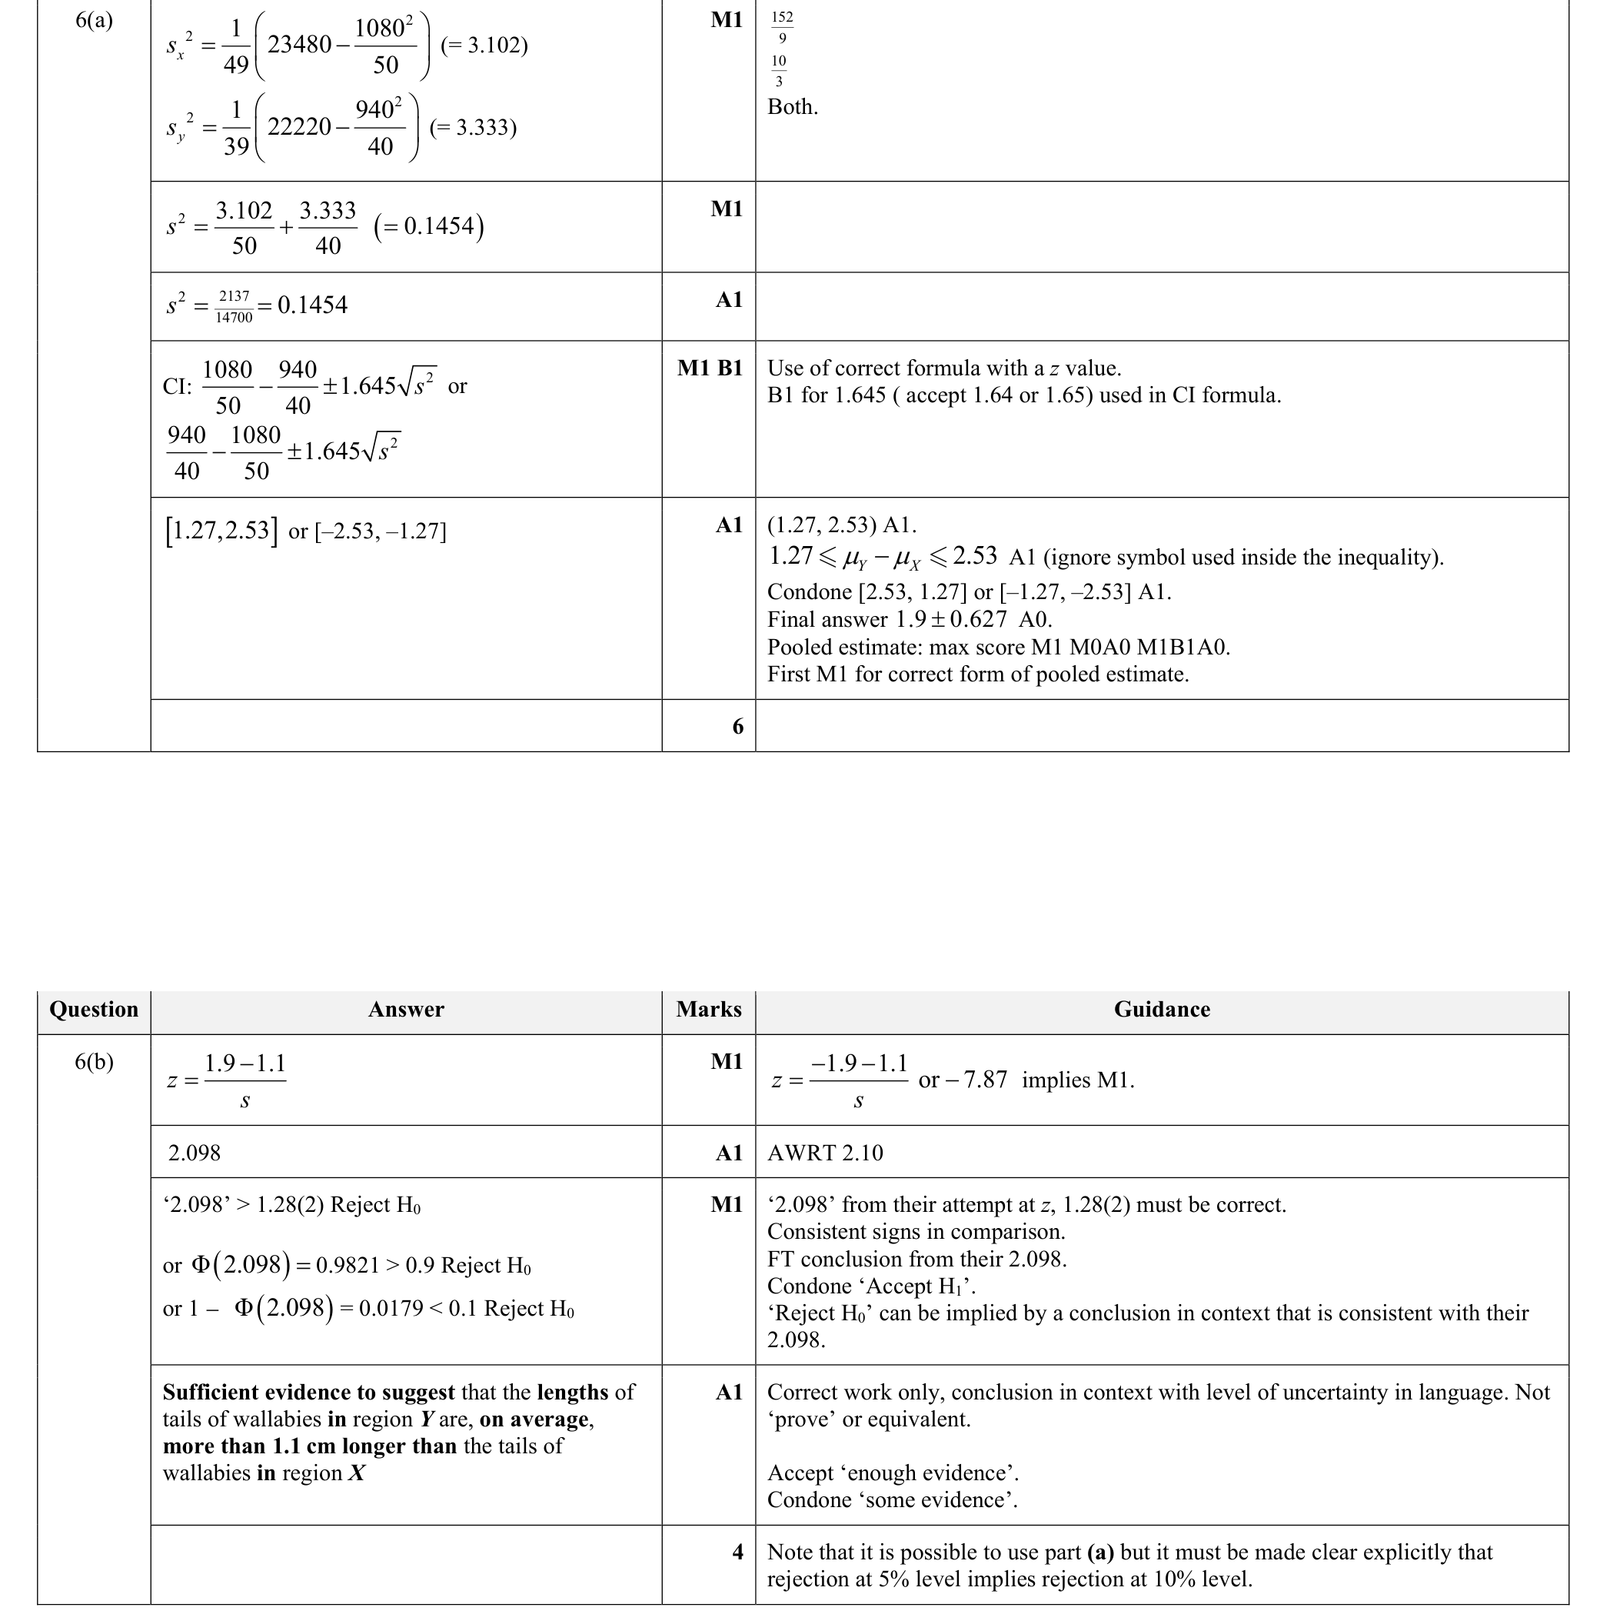
Answer: (a) The sample means are \(\bar x=\frac{1080}{50}=21.6\) and \(\bar y=\frac{940}{40}=23.5\), so the estimated difference is \(\bar y-\bar x=1.9\text{ cm}\).
A \(90\%\) confidence interval for \(\mu_Y-\mu_X\) is
\(1.9 \pm 1.645\sqrt{\frac{3.102}{50}+\frac{3.333}{40}}\)
which gives \((1.27,\,2.53)\).
So the \(90\%\) confidence interval is \(1.27\text{ cm} \lt \mu_Y-\mu_X \lt 2.53\text{ cm}\).
(b) Test statistic:
\(z=\frac{1.9-1.1}{\sqrt{\frac{3.102}{50}+\frac{3.333}{40}}}=2.10\) (approximately).
Since \(2.10\gt 1.282\), reject \(H_0\) at the \(10\%\) level.
There is sufficient evidence to suggest that the mean tail length in region \(Y\) is more than \(1.1\) cm greater than the mean tail length in region \(X\).
(a) First find the sample means.
For region \(X\): \(n_X=50\), so
\(\bar x=\frac{\sum x}{50}=\frac{1080}{50}=21.6\)
For region \(Y\): \(n_Y=40\), so
\(\bar y=\frac{\sum y}{40}=\frac{940}{40}=23.5\)
Hence
\(\bar y-\bar x=23.5-21.6=1.9\)
Now find the sample variances.
For region \(X\):
\(s_X^2=\frac{1}{49}\left(\sum x^2-\frac{(\sum x)^2}{50}\right)=\frac{1}{49}\left(23480-\frac{1080^2}{50}\right)\)
\(=\frac{1}{49}(23480-23328)=\frac{152}{49}\approx 3.102\)
For region \(Y\):
\(s_Y^2=\frac{1}{39}\left(\sum y^2-\frac{(\sum y)^2}{40}\right)=\frac{1}{39}\left(22220-\frac{940^2}{40}\right)\)
\(=\frac{1}{39}(22220-22090)=\frac{130}{39}\approx 3.333\)
Because the population variances cannot be assumed equal, use
\(\mathrm{Var}(\bar y-\bar x)\approx \frac{s_Y^2}{40}+\frac{s_X^2}{50}\)
So
\(\frac{3.333}{40}+\frac{3.102}{50}\approx 0.1454\)
and the standard error is
\(\sqrt{0.1454}\approx 0.3813\)
For a \(90\%\) confidence interval, the critical value is \(1.645\).
Therefore the confidence interval for \(\mu_Y-\mu_X\) is
\((\bar y-\bar x)\pm 1.645\times \text{SE}=1.9\pm 1.645(0.3813)\)
\(=1.9\pm 0.627\)
So the interval is
\((1.273,\,2.527)\)
which to 3 significant figures is \((1.27,\,2.53)\).
(b) We test
\(H_0: \mu_Y-\mu_X=1.1\)
against
\(H_1: \mu_Y-\mu_X\gt 1.1\)
The observed value of \(\bar y-\bar x\) is \(1.9\), and from part (a) the standard error is
\(\sqrt{\frac{3.102}{50}+\frac{3.333}{40}}\approx 0.3813\)
So the test statistic is
\(z=\frac{1.9-1.1}{0.3813}\approx 2.10\)
For a one-tailed test at the \(10\%\) significance level, the critical value is \(1.282\).
Since
\(2.10\gt 1.282\)
the test statistic lies in the critical region, so we reject \(H_0\).
Conclusion: there is sufficient evidence, at the \(10\%\) level, to suggest that the mean tail length in region \(Y\) is more than \(1.1\) cm longer than the mean tail length in region \(X\).