Answer: Let
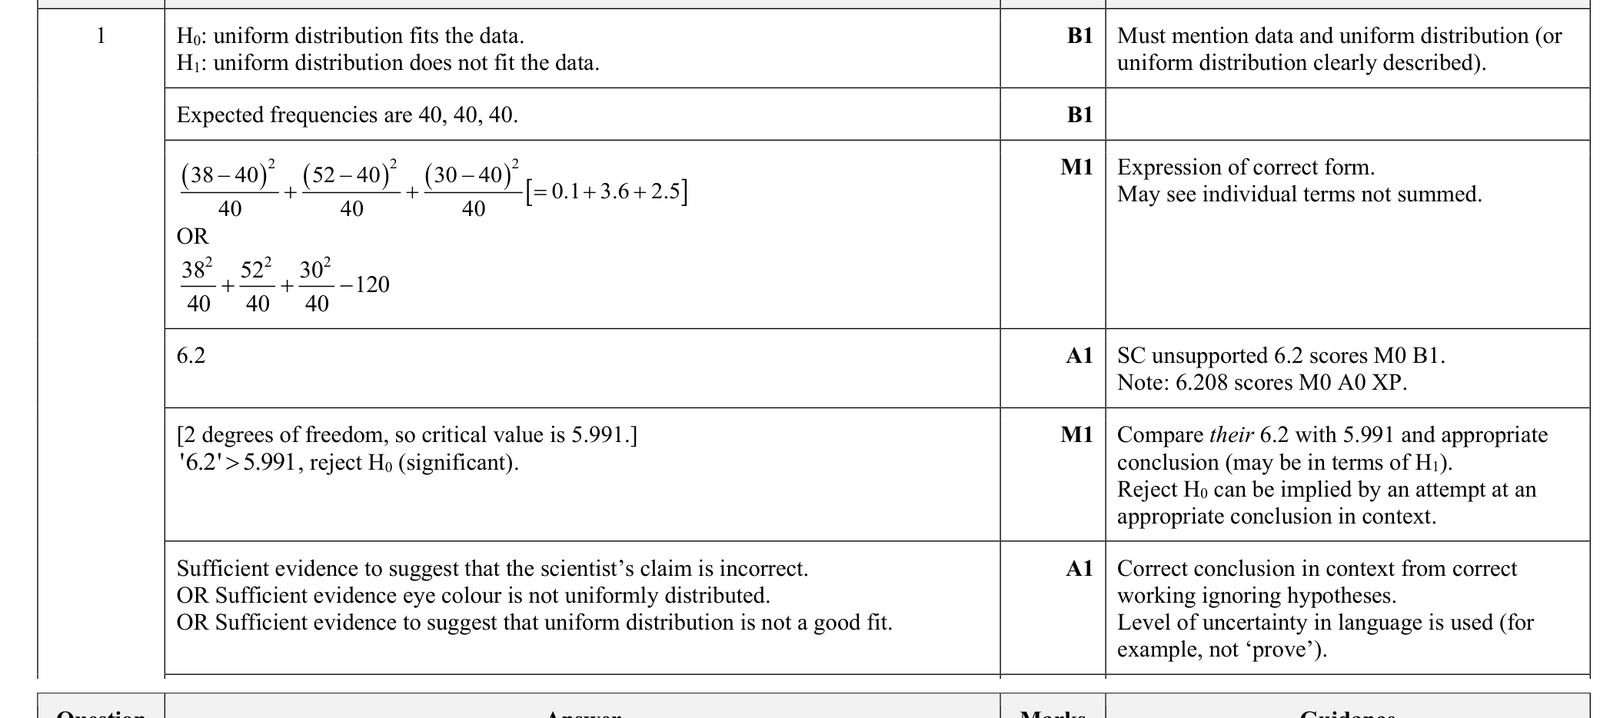
\(H_0\): eye colour is uniformly distributed between brown, blue and other, so each has probability \(\frac13\).
\(H_1\): eye colour is not uniformly distributed.
Expected frequencies for a sample of 120 are \(40,40,40\).
The test statistic is
\(\chi^2=\frac{(38-40)^2}{40}+\frac{(52-40)^2}{40}+\frac{(30-40)^2}{40}=0.1+3.6+2.5=6.2\).
Degrees of freedom \(=3-1=2\).
At the 5% level, the critical value is \(5.991\).
Since \(6.2\gt 5.991\), reject \(H_0\).
There is sufficient evidence at the 5% significance level to conclude that eye colour is not uniformly distributed, so the scientist's claim is not supported by the data.
We use a \(\chi^2\) goodness of fit test.
The scientist claims the three eye-colour categories are equally likely, so under the null hypothesis the distribution is uniform.
The observed frequencies are:
| Eye colour | Brown | Blue | Other | Total |
|---|
| Observed | 38 | 52 | 30 | 120 |
If the distribution is uniform, each category should contain \(\frac{120}{3}=40\) people.
So the expected frequencies are:
| Eye colour | Brown | Blue | Other |
|---|
| Expected | 40 | 40 | 40 |
Now calculate the test statistic:
\(\chi^2=\sum \frac{(O-E)^2}{E}\)
\(\chi^2=\frac{(38-40)^2}{40}+\frac{(52-40)^2}{40}+\frac{(30-40)^2}{40}\)
\(=\frac{4}{40}+\frac{144}{40}+\frac{100}{40}\)
\(=0.1+3.6+2.5\)
\(=6.2\)
The number of degrees of freedom is
\(3-1=2\).
For \(2\) degrees of freedom at the 5% significance level, the critical value is \(5.991\).
Since \(6.2\gt 5.991\), the test statistic lies in the critical region, so we reject \(H_0\).
Therefore, there is sufficient evidence to suggest that the eye colours are not uniformly distributed in the population. The scientist's claim is not supported at the 5% level.