9709 P13 - Nov 2023 - Q8A - 2 marks
518
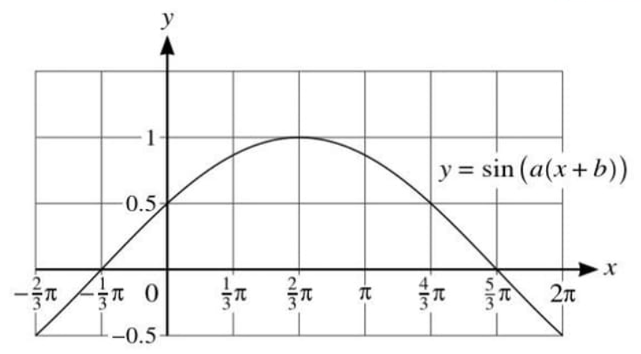
The diagram shows part of the graph of \(y = \sin(a(x + b))\), where \(a\) and \(b\) are positive constants. The graph is plotted with the x-axis ranging from \(-\frac{2}{3}\pi\) to \(2\pi\) and the y-axis ranging from -1 to 1. State the value of \(a\) and one possible value of \(b\).
Solutions locked. Please sign in with access to view them.