Browsing as Guest. Progress, bookmarks and attempts are disabled.
Log in to track your work.
June 2004 p4 q3
3719
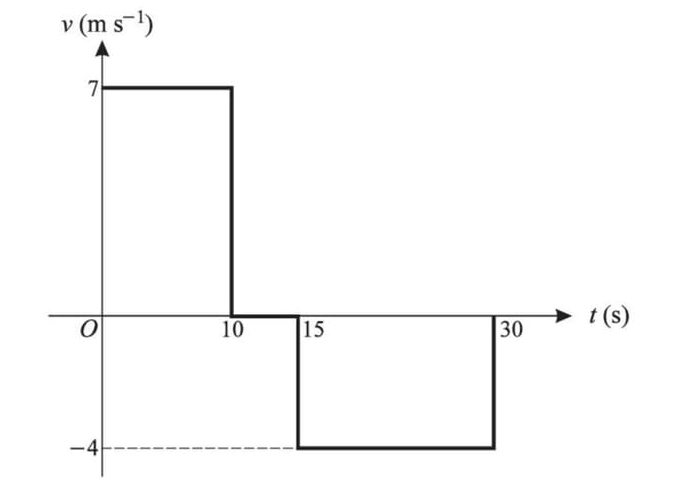
A boy runs from a point A to a point C. He pauses at C and then walks back towards A until reaching the point B, where he stops. The diagram shows the graph of v against t, where v m s-1 is the boy’s velocity at time t seconds after leaving A. The boy runs and walks in the same straight line throughout.
(i) Find the distances AC and AB.
(ii) Sketch the graph of x against t, where x metres is the boy’s displacement from A. Show clearly the values of t and x when the boy arrives at C, when he leaves C, and when he arrives at B.
Solution
(i) To find the distance AC, calculate the area under the velocity-time graph from t = 0 to t = 10 s. The velocity is 7 m/s for 10 seconds, so:
\(AC = 7 \times 10 = 70 \text{ m}\)
To find the distance AB, calculate the net displacement by subtracting the area from t = 15 to t = 30 s (where velocity is -4 m/s) from the distance AC:
\(BC = 4 \times 15 = 60 \text{ m}\)
\(AB = AC - BC = 70 - 60 = 10 \text{ m}\)
(ii) The graph of x against t consists of three connected straight line segments:
From t = 0 to t = 10, x increases linearly from 0 to 70 m.
From t = 10 to t = 15, x remains constant at 70 m.
From t = 15 to t = 30, x decreases linearly from 70 m to 10 m.