9709 P4 - Nov 2005 - Q5
3718
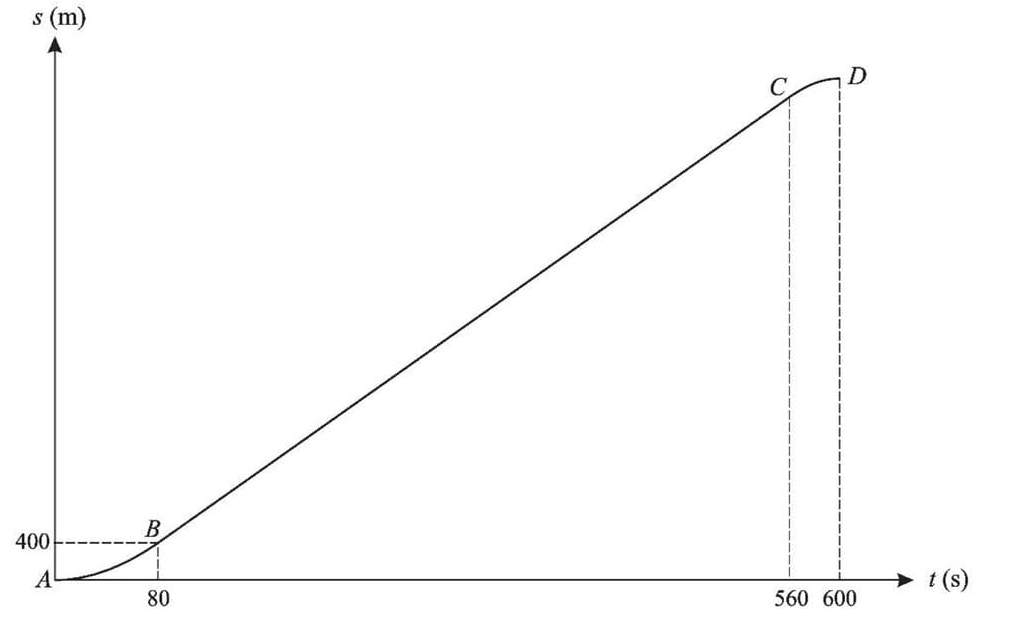
The diagram shows the displacement-time graph for a car’s journey. The graph consists of two curved parts AB and CD, and a straight line BC. The line BC is a tangent to the curve AB at B and a tangent to the curve CD at C. The gradient of the curves at t = 0 and t = 600 is zero, and the acceleration of the car is constant for 0 < t < 80 and for 560 < t < 600. The displacement of the car is 400 m when t = 80.
- Sketch the velocity-time graph for the journey.
- Find the velocity at t = 80.
- Find the total distance for the journey.
- Find the acceleration of the car for 0 < t < 80.
Solutions locked. Please sign in with access to view them.