9709 P43 - Jun 2011 - Q4
3717
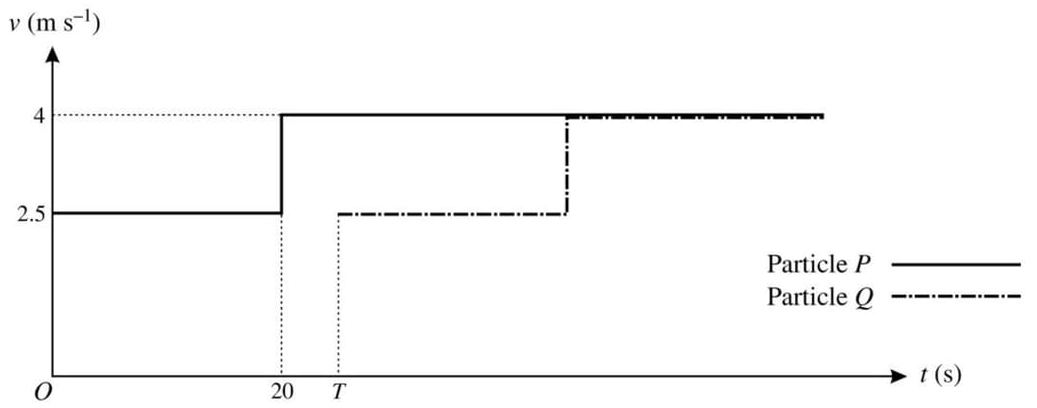
The diagram shows the velocity-time graphs for the motion of two particles P and Q, which travel in the same direction along a straight line. P and Q both start at the same point X on the line, but Q starts to move T s later than P. Each particle moves with speed 2.5 m s-1 for the first 20 s of its motion. The speed of each particle changes instantaneously to 4 m s-1 after it has been moving for 20 s and the particle continues at this speed.
- Make a rough copy of the diagram and shade the region whose area represents the displacement of P from X at the instant when Q starts. [1]
- It is given that P has travelled 70 m at the instant when Q starts. Find the value of T. [2]
- Find the distance between P and Q when Q's speed reaches 4 m s-1. [2]
- Sketch a single diagram showing the displacement-time graphs for both P and Q, with values shown on the t-axis at which the speed of either particle changes. [2]
Solutions locked. Please sign in with access to view them.