9709 P42 - Nov 2020 - Q4
3375
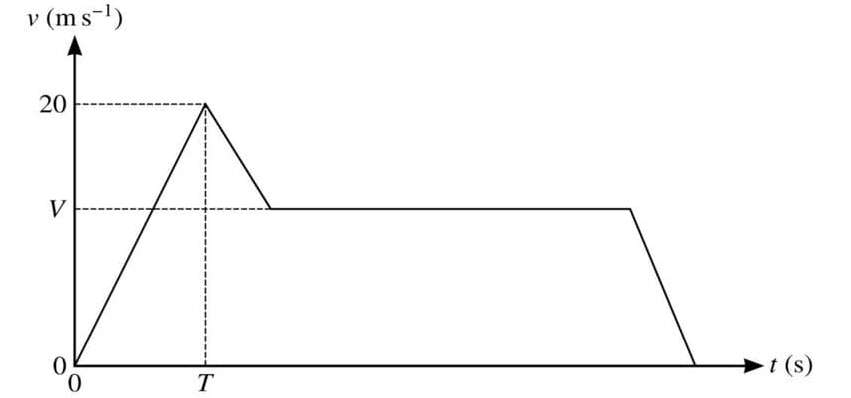
The diagram shows a velocity-time graph which models the motion of a car. The graph consists of four straight line segments. The car accelerates at a constant rate of 2 m s-2 from rest to a speed of 20 m s-1 over a period of T s. It then decelerates at a constant rate for 5 seconds before travelling at a constant speed of V m s-1 for 27.5 s. The car then decelerates to rest at a constant rate over a period of 5 s.
(a) Find T.
(b) Given that the distance travelled up to the point at which the car begins to move with constant speed is one third of the total distance travelled, find V.
Solutions locked. Please sign in with access to view them.