9709 P42 - Nov 2021 - Q1
3374
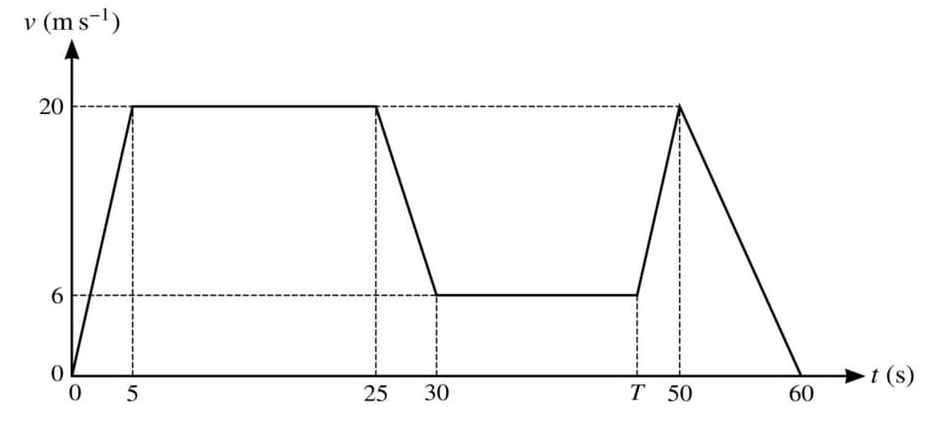
The diagram shows a velocity-time graph which models the motion of a car. The graph consists of six straight line segments. The car accelerates from rest to a speed of 20 m s-1 over a period of 5 s, and then travels at this speed for a further 20 s. The car then decelerates to a speed of 6 m s-1 over a period of 5 s. This speed is maintained for a further (T - 30) s. The car then accelerates again to a speed of 20 m s-1 over a period of (50 - T) s, before decelerating to rest over a period of 10 s.
- Given that during the two stages of the motion when the car is accelerating, the accelerations are equal, find the value of T.
- Find the total distance travelled by the car during the motion.
Solutions locked. Please sign in with access to view them.