9709 P4 - Jun 2003 - Q3
3370
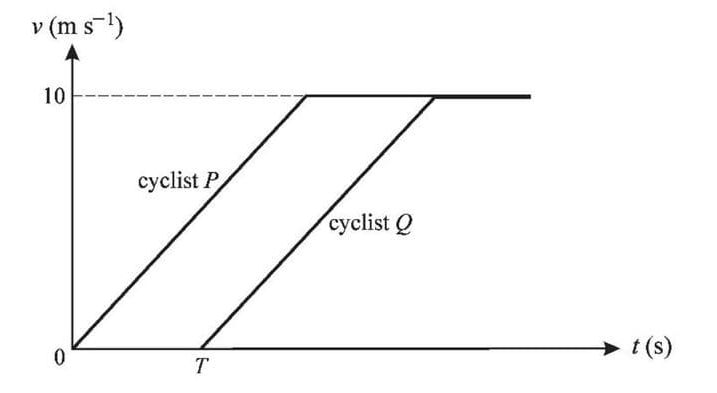
The diagram shows the velocity-time graphs for the motion of two cyclists P and Q, who travel in the same direction along a straight path. Both cyclists start from rest at the same point O and both accelerate at 2 m s-2 up to a speed of 10 m s-1. Both then continue at a constant speed of 10 m s-1. Q starts his journey T seconds after P.
- Show in a sketch of the diagram the region whose area represents the displacement of P, from O, at the instant when Q starts.
- Given that P has travelled 16 m at the instant when Q starts, find
- the value of T,
- the distance between P and Q when Q's speed reaches 10 m s-1.
Solutions locked. Please sign in with access to view them.