Browsing as Guest. Progress, bookmarks and attempts are disabled.
Log in to track your work.
June 2016 p42 q4
3365
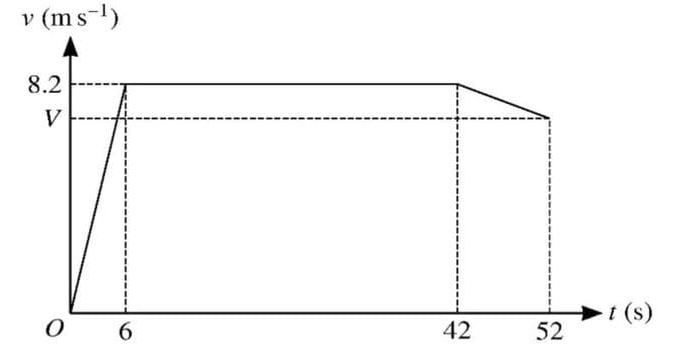
A sprinter runs a race of 400 m. His total time for running the race is 52 s. The diagram shows the velocity-time graph for the motion of the sprinter. He starts from rest and accelerates uniformly to a speed of 8.2 m/s in 6 s. The sprinter maintains a speed of 8.2 m/s for 36 s, and he then decelerates uniformly to a speed of V m/s at the end of the race.
(i) Calculate the distance covered by the sprinter in the first 42 s of the race.
\((ii) Show that V = 7.84.\)
(iii) Calculate the deceleration of the sprinter in the last 10 s of the race.
Solution
(i) The distance covered in the first 42 s is the area under the velocity-time graph from 0 to 42 s. This consists of a triangle and a rectangle. The area of the triangle is \(\frac{1}{2} \times 6 \times 8.2 = 24.6\) m. The area of the rectangle is \(36 \times 8.2 = 295.2\) m. Therefore, the total distance is \(24.6 + 295.2 = 319.8\) m.
(ii) The total distance for the race is 400 m. The distance covered in the last 10 s is \(400 - 319.8 = 80.2\) m. The area under the graph from 42 s to 52 s is a trapezium with parallel sides 8.2 m/s and V m/s, and height 10 s. The area is \(\frac{1}{2} \times (8.2 + V) \times 10 = 80.2\). Solving for V gives \(V = 7.84\).
(iii) The deceleration is the change in velocity over time. The change in velocity is \(8.2 - 7.84 = 0.36\) m/s over 10 s. Therefore, the deceleration is \(\frac{0.36}{10} = 0.036\) m/s2.