9709 P41 - Nov 2023 - Q3
3362
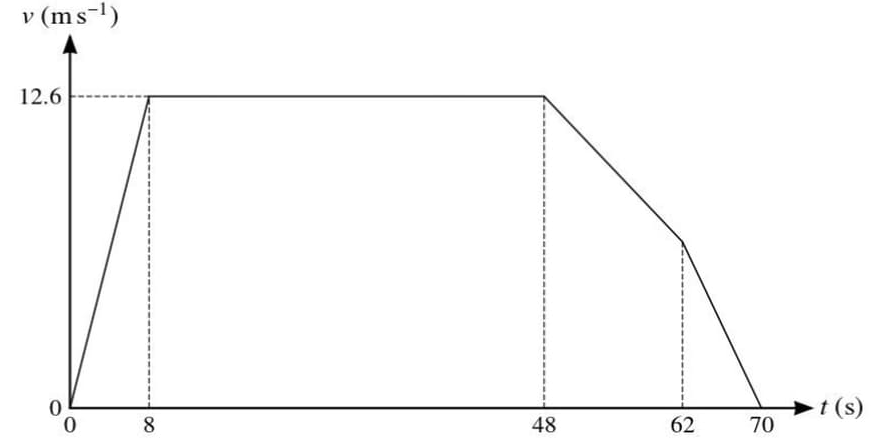
The diagram shows the velocity-time graph for the motion of a bus. The bus starts from rest and accelerates uniformly for 8 seconds until it reaches a speed of 12.6 m/s. The bus maintains this speed for 40 seconds. It then decelerates uniformly in two stages. Between 48 and 62 seconds the bus decelerates at \(a \text{ m/s}^2\) and between 62 and 70 seconds it decelerates at \(2a \text{ m/s}^2\) until coming to rest.
(a) Find the distance covered by the bus in the first 8 seconds.
(b) Find the value of \(a\).
(c) Find the average speed of the bus for the whole journey.
Solutions locked. Please sign in with access to view them.