Browsing as Guest. Progress, bookmarks and attempts are disabled.
Log in to track your work.
Nov 2009 p62 q1
3272
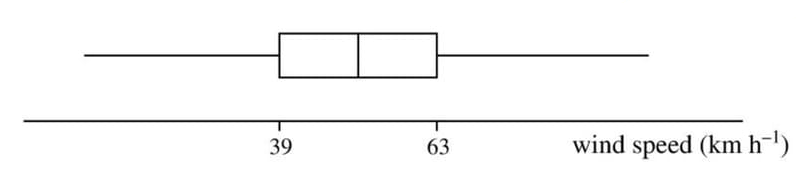
Measurements of wind speed on a certain island were taken over a period of one year. A box-and-whisker plot of the data obtained is displayed above, and the values of the quartiles are as shown. It is suggested that wind speed can be modelled approximately by a normal distribution with mean \(\mu\) km h\(^{-1}\) and standard deviation \(\sigma\) km h\(^{-1}\).
(i) Estimate the value of \(\mu\).
(ii) Estimate the value of \(\sigma\).
Solution
(i) The mean \(\mu\) is estimated as the median of the data, which is the middle value of the box-and-whisker plot. From the diagram, the median is 51 km h\(^{-1}\).
(ii) To estimate the standard deviation \(\sigma\), we use the interquartile range (IQR) and the properties of the normal distribution. The IQR is the difference between the upper quartile (63 km h\(^{-1}\)) and the median (51 km h\(^{-1}\)), which is 12 km h\(^{-1}\).
For a normal distribution, the IQR corresponds to approximately 1.34896 standard deviations (since \(z = \pm 0.674\) for the quartiles). Therefore, \(\sigma\) can be estimated by: