9709 P6 - Nov 2003 - Q7
3166
The length of time a person undergoing a routine operation stays in hospital can be modelled by a normal distribution with mean 7.8 days and standard deviation 2.8 days.
- Calculate the proportion of people who spend between 7.8 days and 11.0 days in hospital.
- Calculate the probability that, of 3 people selected at random, exactly 2 spend longer than 11.0 days in hospital.
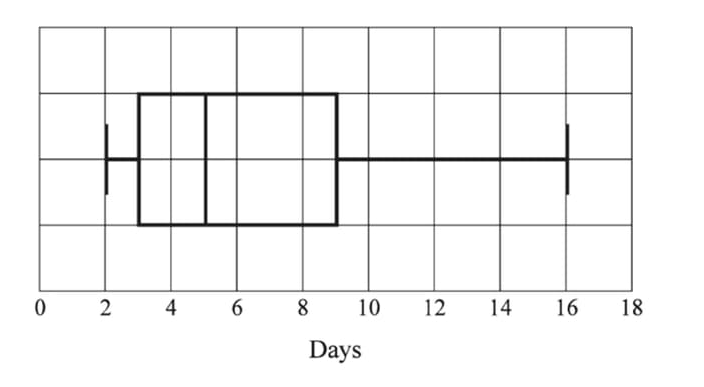
- A health worker plotted a box-and-whisker plot of the times that 100 patients, chosen randomly, stayed in hospital. The result is shown below. State with a reason whether or not this agrees with the model used in parts (i) and (ii).
\( \)
\)
Solutions locked. Please sign in with access to view them.