9709 P51 - Nov 2021 - Q6
2504
The weights, in kg, of 15 rugby players in the Rebels club and 15 soccer players in the Sharks club are shown below.
| Rebels | 75 | 78 | 79 | 80 | 82 | 82 | 83 | 84 | 85 | 86 | 89 | 93 | 95 | 99 | 102 |
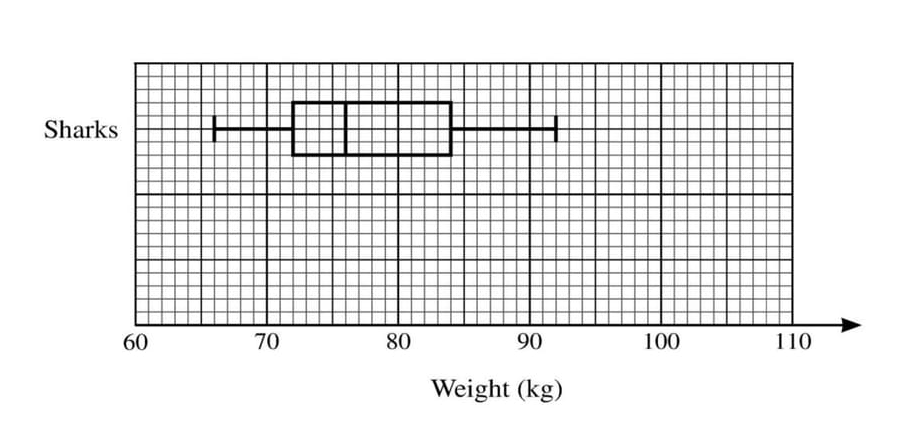
| Sharks | 66 | 68 | 71 | 72 | 74 | 75 | 75 | 76 | 78 | 83 | 83 | 84 | 85 | 86 | 92 |
(a) Represent the data by drawing a back-to-back stem-and-leaf diagram with Rebels on the left-hand side of the diagram.
(b) Find the median and the interquartile range for the Rebels.
A box-and-whisker plot for the Sharks is shown below.
(c) On the same diagram, draw a box-and-whisker plot for the Rebels.
(d) Make one comparison between the weights of the players in the Rebels club and the weights of the players in the Sharks club.
Solutions locked. Please sign in with access to view them.