Browsing as Guest. Progress, bookmarks and attempts are disabled.
Log in to track your work.
June 2021 p53 q1
2486
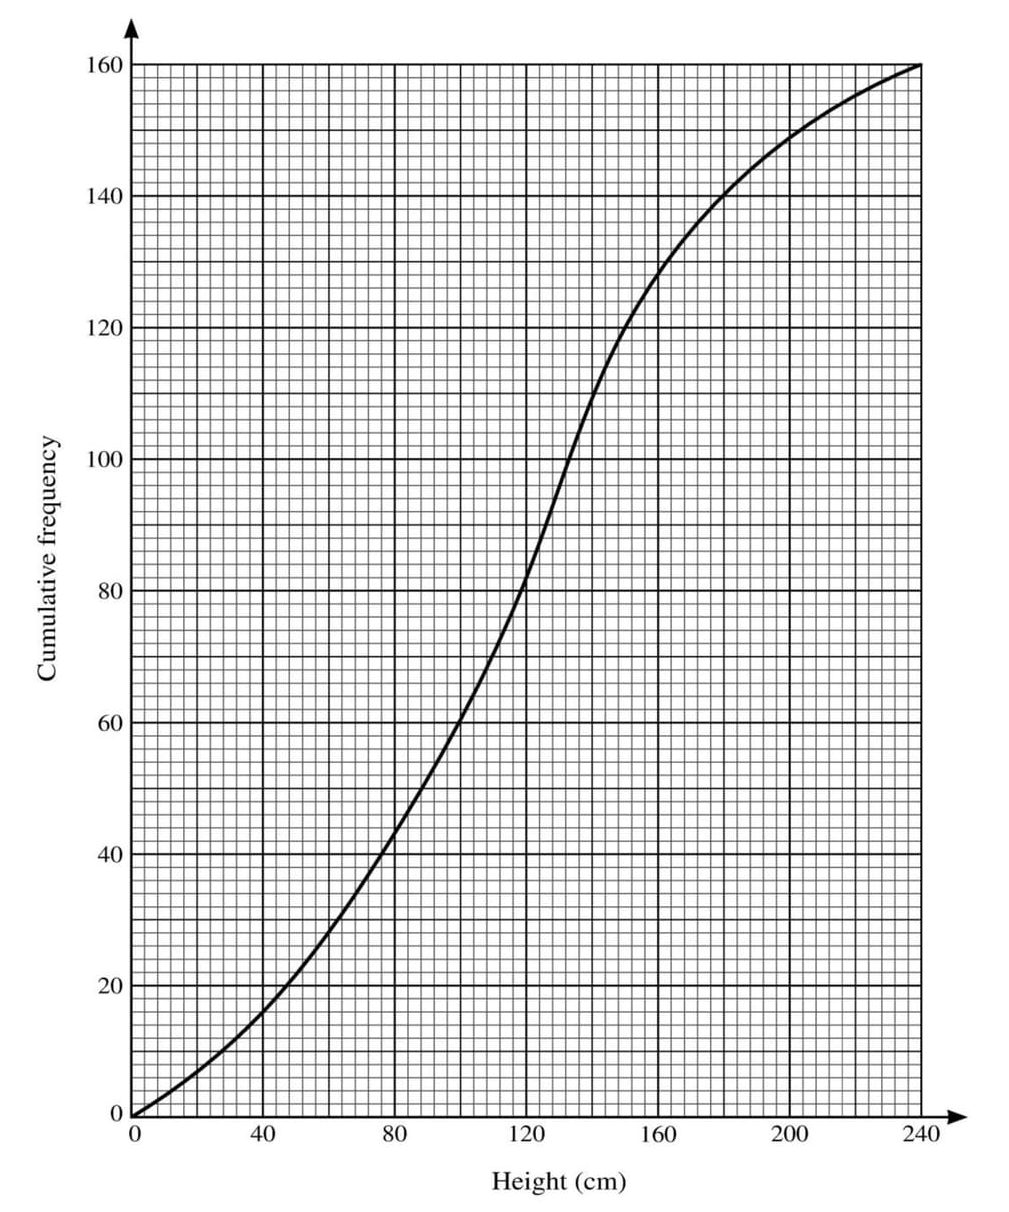
The heights in cm of 160 sunflower plants were measured. The results are summarised on the following cumulative frequency curve.
(a) Use the graph to estimate the number of plants with heights less than 100 cm.
(b) Use the graph to estimate the 65th percentile of the distribution.
(c) Use the graph to estimate the interquartile range of the heights of these plants.
Solution
(a) To estimate the number of plants with heights less than 100 cm, locate 100 cm on the x-axis and find the corresponding cumulative frequency on the y-axis. The graph shows approximately 60 plants.
(b) The 65th percentile corresponds to 65% of 160 plants, which is 104 plants. Locate 104 on the y-axis and find the corresponding height on the x-axis. The graph shows this height to be approximately 136 cm.
(c) The interquartile range (IQR) is the difference between the upper quartile (Q3) and the lower quartile (Q1). For 160 plants, Q1 is at the 40th plant (25% of 160) and Q3 is at the 120th plant (75% of 160). From the graph, Q1 is approximately 76 cm and Q3 is approximately 150 cm. Therefore, the IQR is 150 - 76 = 74 cm.