Browsing as Guest. Progress, bookmarks and attempts are disabled.
Log in to track your work.
June 2010 p62 q3
2478
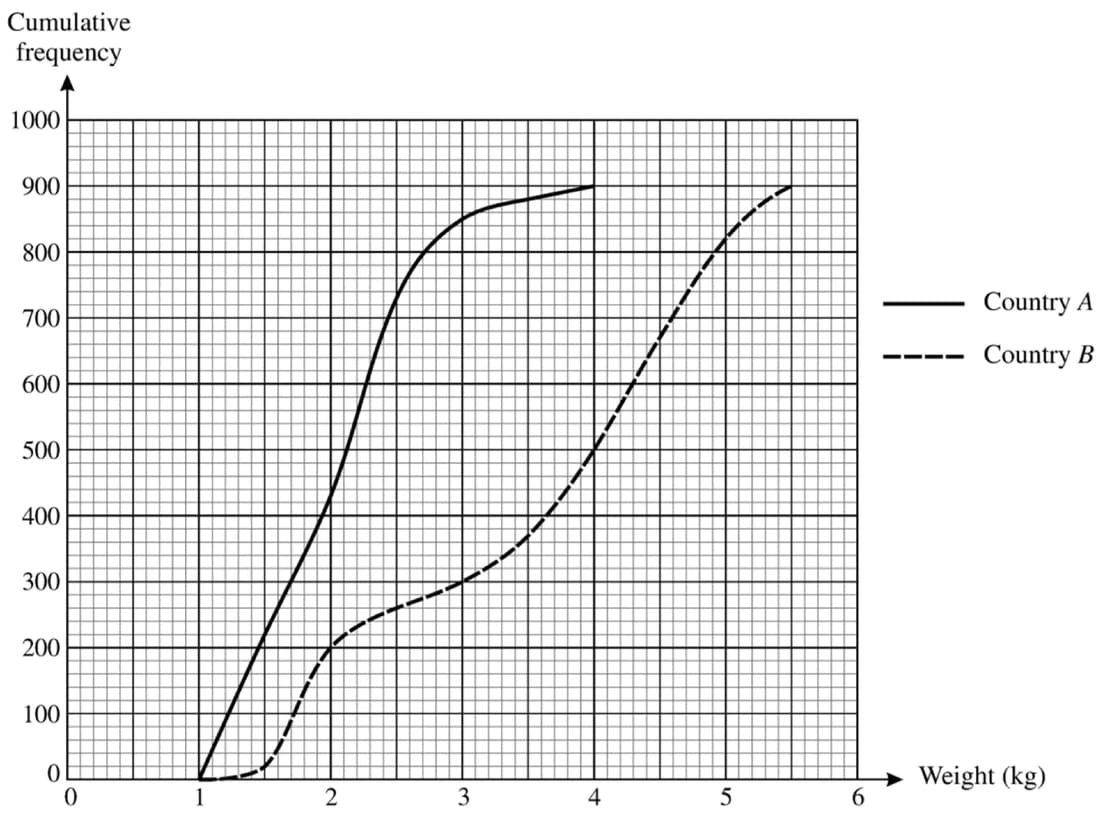
The birth weights of random samples of 900 babies born in country A and 900 babies born in country B are illustrated in the cumulative frequency graphs. Use suitable data from these graphs to compare the central tendency and spread of the birth weights of the two sets of babies.
Solution
To compare the central tendency, we find the medians from the cumulative frequency graphs:
Median for Country A: approximately 2.0 to 2.1 kg.
Median for Country B: approximately 3.8 to 3.9 kg.
Alternatively, using means:
Mean for Country A: approximately 2.0 to 2.1 kg.
Mean for Country B: approximately 3.4 to 3.5 kg.
Country B has a higher median and mean, indicating heavier babies on average.
To compare the spread, we calculate the interquartile range (IQR) or standard deviation (sd):
IQR for Country A: 2.4 - 1.5 = 0.9 kg or sd = 0.5 to 0.7 kg.
IQR for Country B: 4.5 - 2.2 = 2.3 kg or sd = 1.2 to 1.4 kg.
Country B has a greater IQR and sd, indicating a greater spread of weights.