9709 P63 - Nov 2011 - Q5
2473
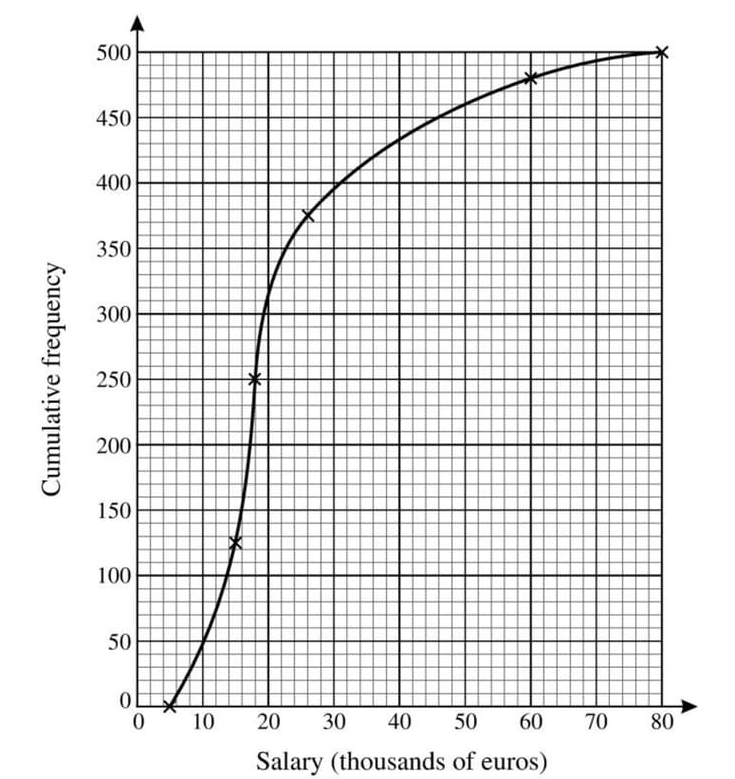
The cumulative frequency graph shows the annual salaries, in thousands of euros, of a random sample of 500 adults with jobs, in France. It has been plotted using grouped data. You may assume that the lowest salary is 5000 euros and the highest salary is 80000 euros.
- On graph paper, draw a box-and-whisker plot to illustrate these salaries.
- Comment on the salaries of the people in this sample.
- An ‘outlier’ is defined as any data value which is more than 1.5 times the interquartile range above the upper quartile, or more than 1.5 times the interquartile range below the lower quartile.
- How high must a salary be in order to be classified as an outlier?
- Show that none of the salaries is low enough to be classified as an outlier.
Solutions locked. Please sign in with access to view them.