9709 P62 - Jun 2015 - Q3
2470
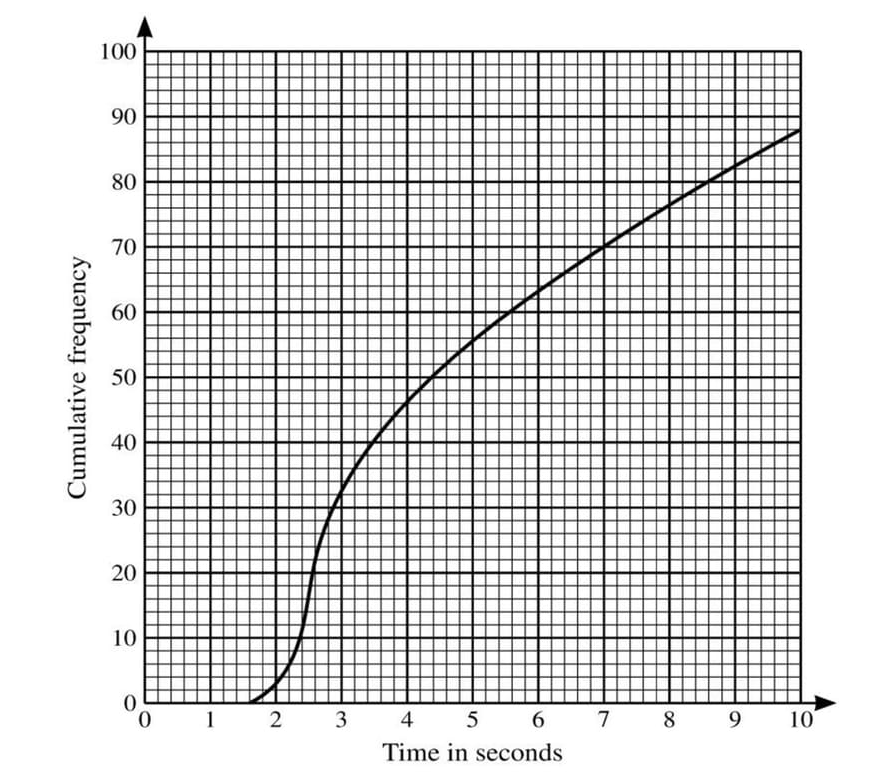
In an open-plan office there are 88 computers. The times taken by these 88 computers to access a particular web page are represented in the cumulative frequency diagram.
(i) On graph paper draw a box-and-whisker plot to summarise this information.An ‘outlier’ is defined as any data value which is more than 1.5 times the interquartile range above the upper quartile, or more than 1.5 times the interquartile range below the lower quartile.
(ii) Show that there are no outliers.
Solutions locked. Please sign in with access to view them.