9709 P51 - Nov 2023 - Q1
2466
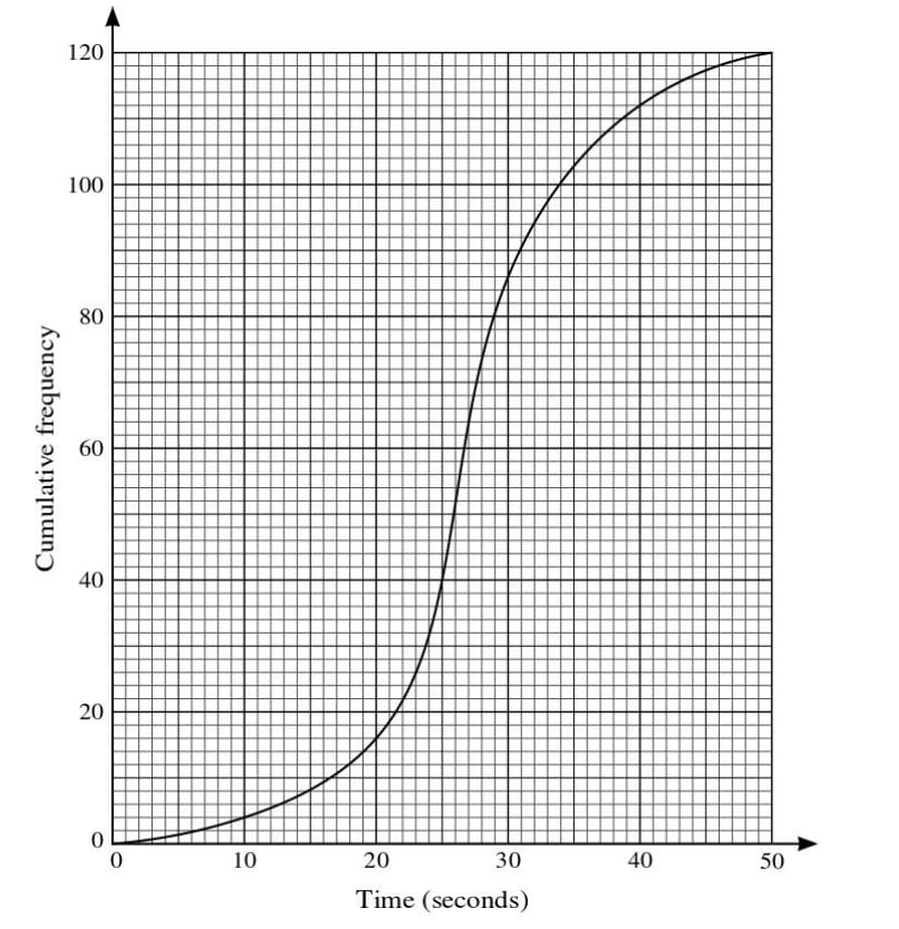
The times taken by 120 children to complete a particular puzzle are represented in the cumulative frequency graph.
(a) Use the graph to estimate the interquartile range of the data.
35% of the children took longer than \(T\) seconds to complete the puzzle.
(b) Use the graph to estimate the value of \(T\).
Solutions locked. Please sign in with access to view them.