Browsing as Guest. Progress, bookmarks and attempts are disabled.
Log in to track your work.
June 2017 p62 q2
2465
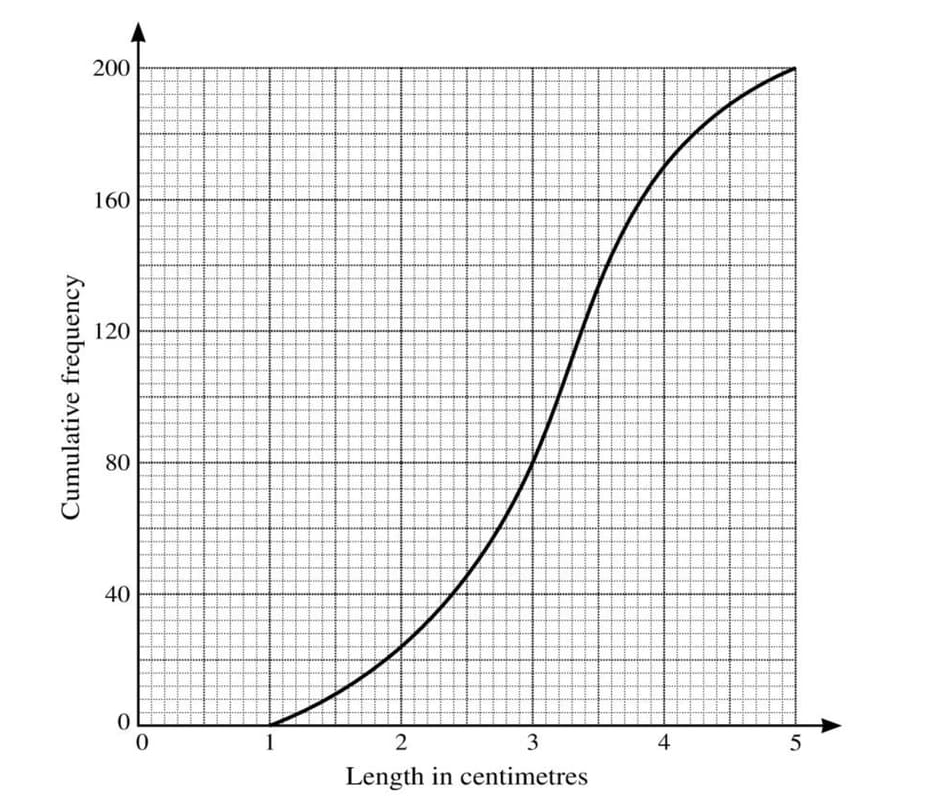
Anabel measured the lengths, in centimetres, of 200 caterpillars. Her results are illustrated in the cumulative frequency graph below.
(i) Estimate the median and the interquartile range of the lengths.
(ii) Estimate how many caterpillars had a length of between 2 and 3.5 cm.
(iii) 6% of caterpillars were of length \(l\) centimetres or more. Estimate \(l\).
Solution
(i) To find the median, locate the 100th caterpillar on the cumulative frequency graph (since there are 200 caterpillars). The median length is approximately 3.2 cm. For the interquartile range, find the lower quartile (50th caterpillar) and upper quartile (150th caterpillar). The lower quartile is approximately 2.6 cm and the upper quartile is approximately 3.7 cm. Thus, the interquartile range (IQR) is \(3.7 - 2.6 = 1.1\) cm.
(ii) To estimate the number of caterpillars with lengths between 2 and 3.5 cm, find the cumulative frequencies at these lengths. At 2 cm, the cumulative frequency is approximately 24, and at 3.5 cm, it is approximately 134. Therefore, the number of caterpillars is \(134 - 24 = 110\).
(iii) 6% of 200 caterpillars is 12 caterpillars. Therefore, 188 caterpillars have lengths less than \(l\). Locate the 188th caterpillar on the graph to estimate \(l\). The length \(l\) is approximately 4.5 cm.