9709 P63 - Jun 2017 - Q7
2464
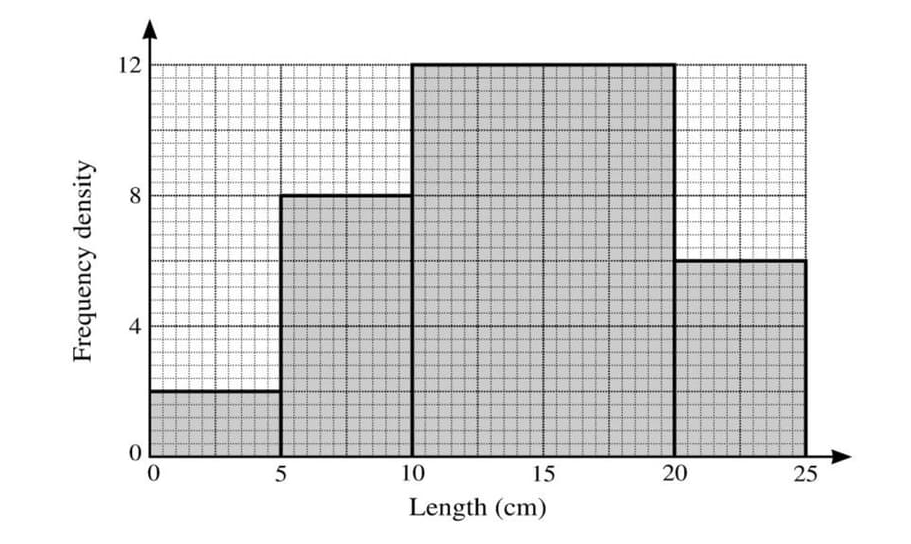
The following histogram represents the lengths of worms in a garden.
(i) Calculate the frequencies represented by each of the four histogram columns.
(ii) On the grid on the next page, draw a cumulative frequency graph to represent the lengths of worms in the garden.
(iii) Use your graph to estimate the median and interquartile range of the lengths of worms in the garden.
(iv) Calculate an estimate of the mean length of worms in the garden.
Solutions locked. Please sign in with access to view them.