9709 P63 - Nov 2019 - Q5
2459
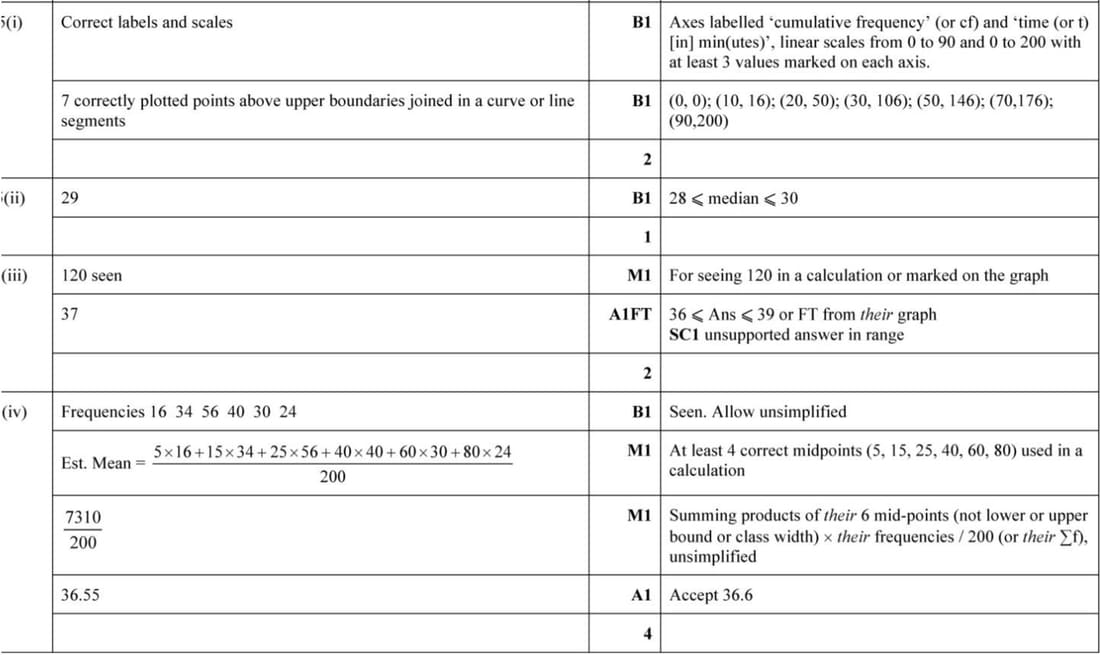
Last Saturday, 200 drivers entering a car park were asked the time, in minutes, that it had taken them to travel from home to the car park. The results are summarised in the following cumulative frequency table.
| Time (t minutes) | \(t \leq 10\) | \(t \leq 20\) | \(t \leq 30\) | \(t \leq 50\) | \(t \leq 70\) | \(t \leq 90\) |
|---|---|---|---|---|---|---|
| Cumulative frequency | 16 | 50 | 106 | 146 | 176 | 200 |
- On the grid, draw a cumulative frequency graph to illustrate the data. [2]
- Use your graph to estimate the median of the data. [1]
- For 80 of the drivers, the time taken was at least \(T\) minutes. Use your graph to estimate the value of \(T\). [2]
- Calculate an estimate of the mean time taken by all 200 drivers to travel to the car park. [4]