9709 P61 - Jun 2019 - Q4
2458
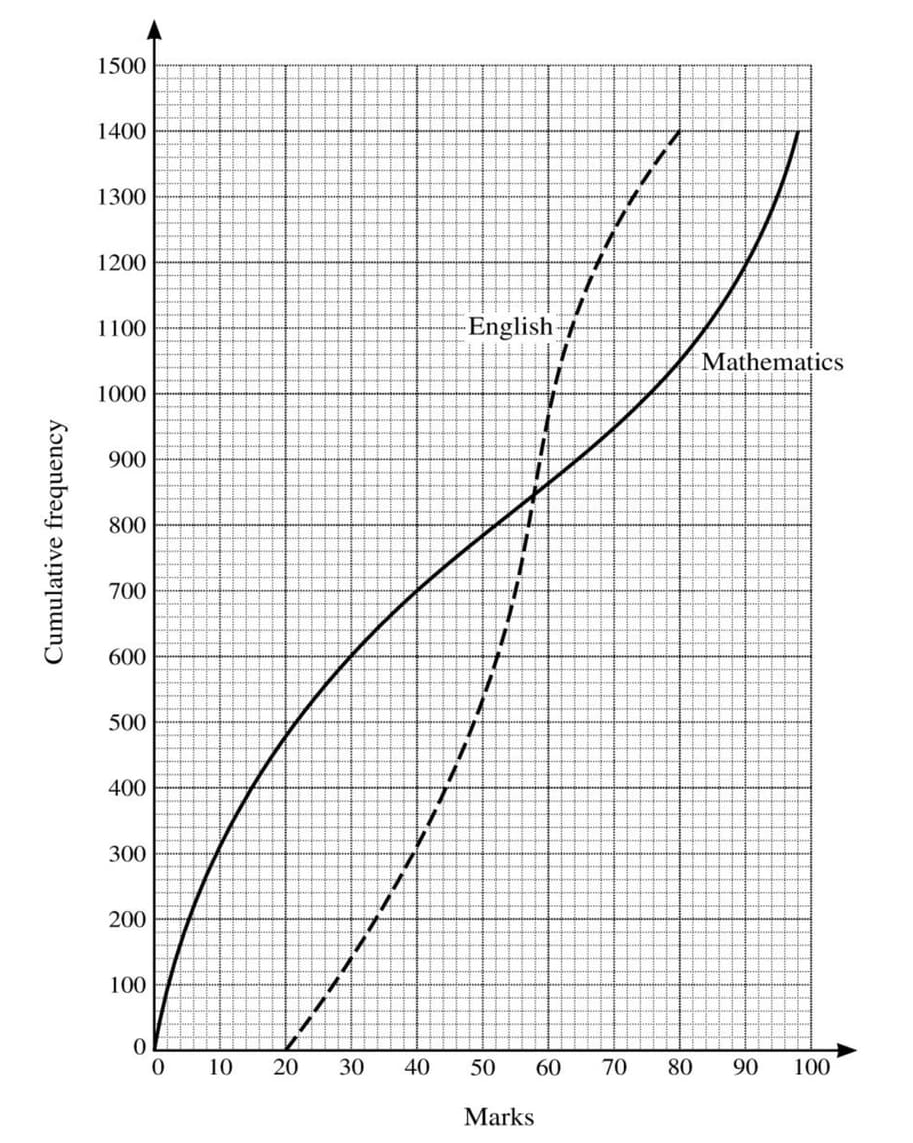
The Mathematics and English A-level marks of 1400 pupils all taking the same examinations are shown in the cumulative frequency graphs below. Both examinations are marked out of 100.
Use suitable data from these graphs to compare the central tendency and spread of the marks in Mathematics and English.
Solutions locked. Please sign in with access to view them.