9709 P61 - Nov 2019 - Q5
2457
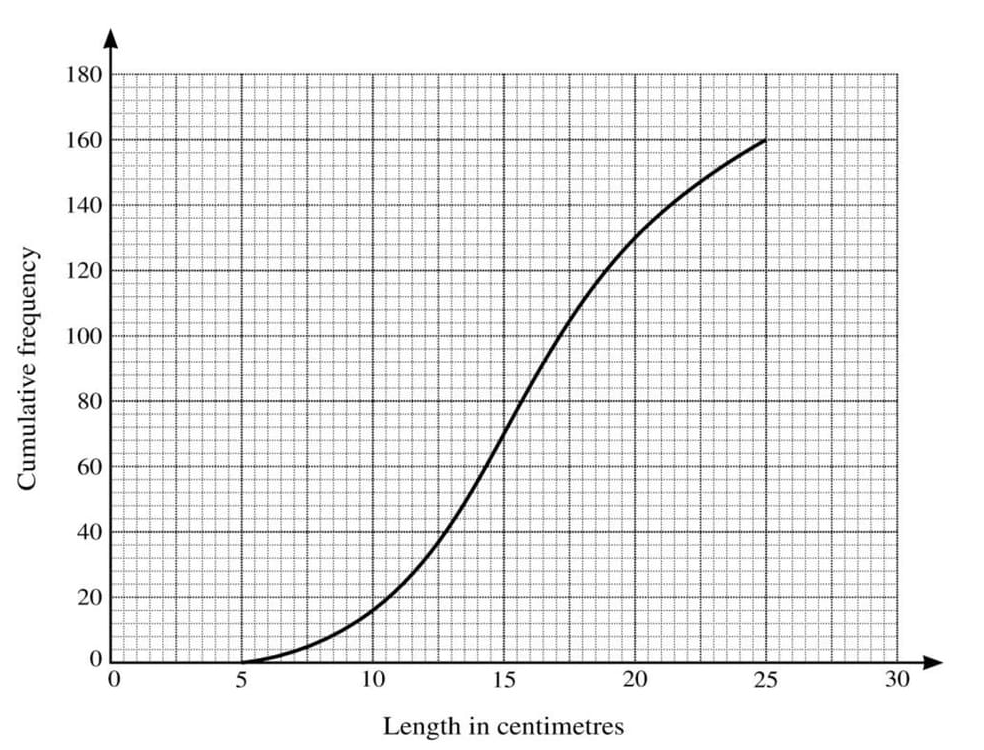
Ransha measured the lengths, in centimetres, of 160 palm leaves. His results are illustrated in the cumulative frequency graph below.
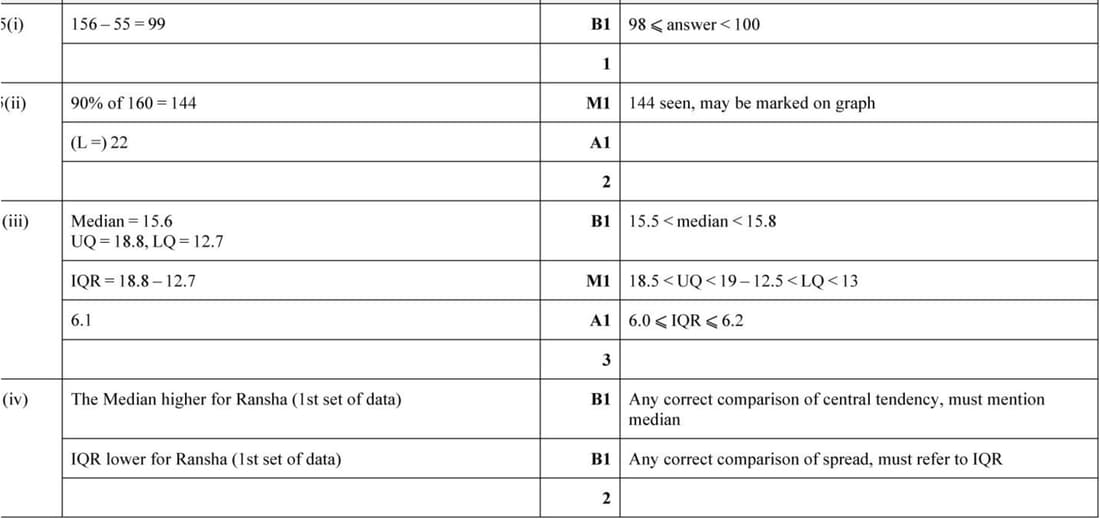
(i) Estimate how many leaves have a length between 14 and 24 centimetres.
(ii) 10% of the leaves have a length of \(L\) centimetres or more. Estimate the value of \(L\).
(iii) Estimate the median and the interquartile range of the lengths.
Sharim measured the lengths, in centimetres, of 160 palm leaves of a different type. He drew a box-and-whisker plot for the data, as shown on the grid below.
(iv) Compare the central tendency and the spread of the two sets of data.