Browsing as Guest. Progress, bookmarks and attempts are disabled.
Log in to track your work.
June 2006 p6 q5
2412
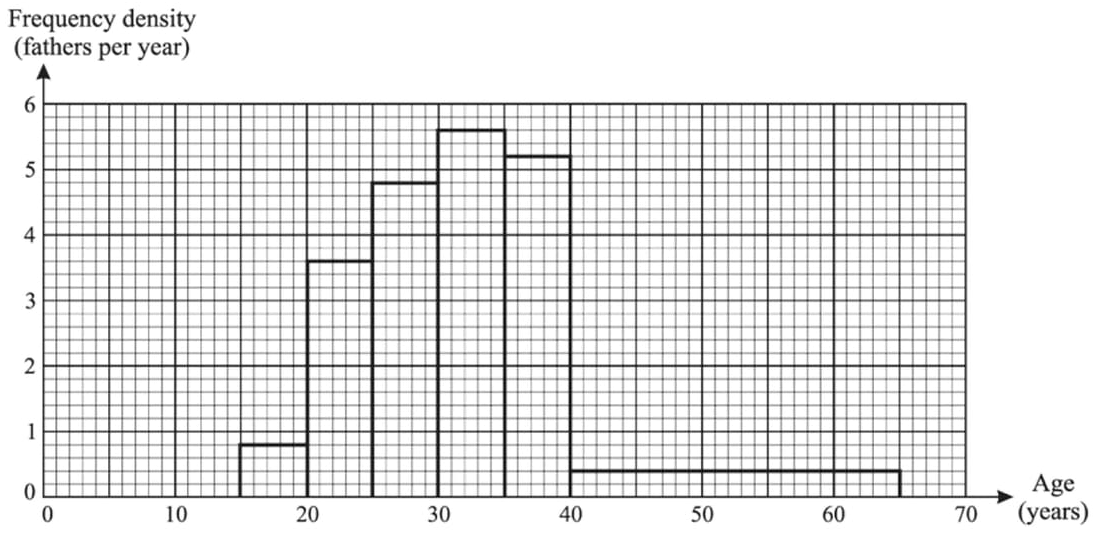
Each father in a random sample of fathers was asked how old he was when his first child was born. The following histogram represents the information.
What is the modal age group?
How many fathers were between 25 and 30 years old when their first child was born?
How many fathers were in the sample?
Solution
(i) The modal age group is the one with the highest frequency density. From the histogram, the age group 30-35 years has the highest frequency density.
(ii) To find the number of fathers between 25 and 30 years old, multiply the frequency density by the class width. The frequency density for 25-30 years is 4.8, and the class width is 5 years. Therefore, the number of fathers is:
\(4.8 \times 5 = 24\)
(iii) To find the total number of fathers in the sample, sum the frequencies for all age groups. The frequencies are calculated by multiplying the frequency density by the class width for each group: