Browsing as Guest. Progress, bookmarks and attempts are disabled.
Log in to track your work.
Nov 2010 p63 q5
2406
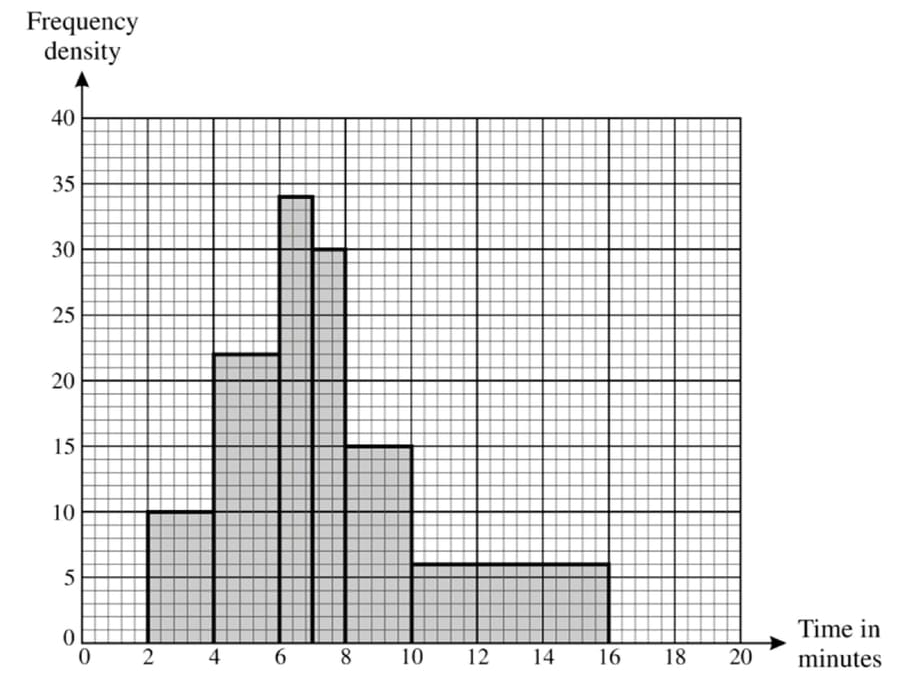
The following histogram illustrates the distribution of times, in minutes, that some students spent taking a shower.
(i) Copy and complete the following frequency table for the data.
Time \( t \) (minutes)
\( 2 < t \le 4 \)
\( 4 < t \le 6 \)
\( 6 < t \le 7 \)
\( 7 < t \le 8 \)
\( 8 < t \le 10 \)
\( 10 < t \le 16 \)
Frequency
(ii) Calculate an estimate of the mean time to take a shower.
Solution
(i) To find the frequencies, use the frequency density from the histogram. The frequency is calculated by multiplying the frequency density by the class width.
For \( 2 < t \le 4 \): Frequency density \(= 10\), Width \(= 2\), Frequency \(= 10 \times 2 = 20\)
For \( 4 < t \le 6 \): Frequency density \(= 22\), Width \(= 2\), Frequency \(= 22 \times 2 = 44\)
For \( 6 < t \le 7 \): Frequency density \(= 34\), Width \(= 1\), Frequency \(= 34 \times 1 = 34\)
For \( 7 < t \le 8 \): Frequency density \(= 30\), Width \(= 1\), Frequency \(= 30 \times 1 = 30\)
For \( 8 < t \le 10 \): Frequency density \(= 15\), Width \(= 2\), Frequency \(= 15 \times 2 = 30\)
For \( 10 < t \le 16 \): Frequency density \(= 6\), Width \(= 6\), Frequency \(= 6 \times 6 = 36\)
(ii) To estimate the mean time, calculate the midpoints of each class interval and use them to find the mean: