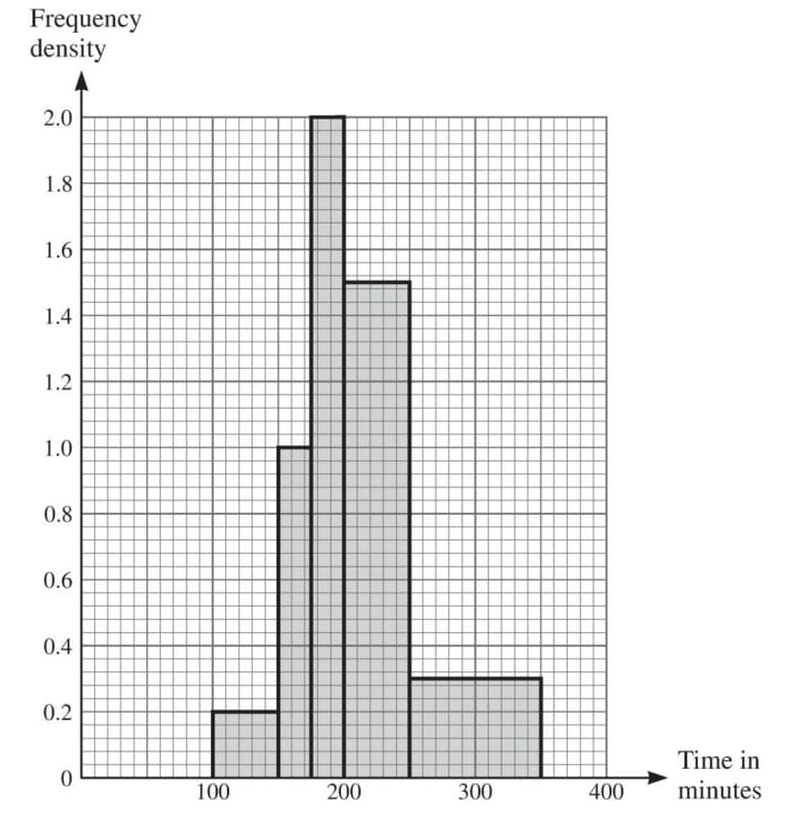
The following histogram summarises the times, in minutes, taken by 190 people to complete a race.
(i) Show that 75 people took between 200 and 250 minutes to complete the race.
(ii) Calculate estimates of the mean and standard deviation of the times of the 190 people.
(iii) Explain why your answers to part (ii) are estimates.
Solution
(i) The frequency density for the interval 200 to 250 is 1.5. The width of the interval is 50. Therefore, the number of people is given by:
\(1.5 \times 50 = 75\)
(ii) The frequencies for each interval are 10, 25, 50, 75, 30. The mid-points of the intervals are 125, 162.5, 187.5, 225, 300.
Mean calculation:
\(\text{Mean} = \frac{(10 \times 125) + (25 \times 162.5) + (50 \times 187.5) + (75 \times 225) + (30 \times 300)}{190}\)
\(= \frac{40562.5}{190} = 213\)
Standard deviation calculation:
\(sd^2 = \frac{10 \times 125^2 + 25 \times 162.5^2 + 50 \times 187.5^2 + 75 \times 225^2 + 30 \times 300^2}{190} - (213)^2\)
\(sd = 46.5 \text{ or } 46.6\)
(iii) The answers are estimates because the mid-points of each interval were used instead of the raw data.
Log in to record attempts.