9709 P6 - Jun 2003 - Q1
2380
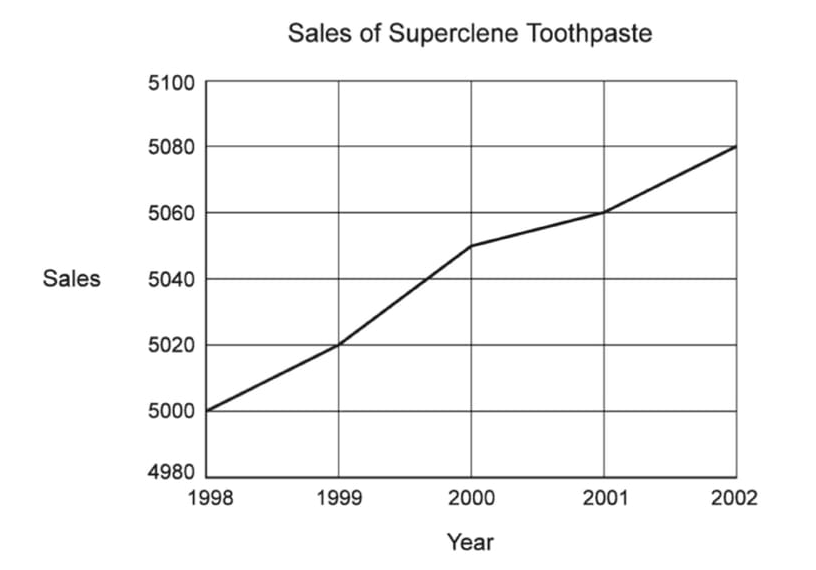
(i) The diagram represents the sales of Superclene toothpaste over the last few years. Give a reason why it is misleading.
(ii) The following data represent the daily ticket sales at a small theatre during three weeks.
52, 73, 34, 85, 62, 79, 89, 50, 45, 83, 84, 91, 85, 84, 87, 44, 86, 41, 35, 73, 86.
(a) Construct a stem-and-leaf diagram to illustrate the data.
(b) Use your diagram to find the median of the data.
Solutions locked. Please sign in with access to view them.