9709 P31 - Nov 2011 - Q9
1758
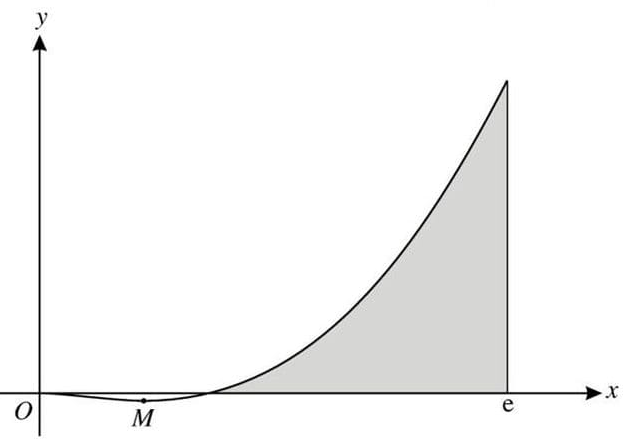
The diagram shows the curve \(y = x^2 \ln x\) and its minimum point \(M\).
(i) Find the exact values of the coordinates of \(M\).
(ii) Find the exact value of the area of the shaded region bounded by the curve, the \(x\)-axis and the line \(x = e\).
Solutions locked. Please sign in with access to view them.