Browsing as Guest. Answer checking, progress and bookmarks are disabled. Log in to track your work.
Practice — Maths 11 • Integration
Antiderivative. Rules of integration. Definite integral. Area of a curvilinear trapezoid
Difficulty: ★★☆
1836
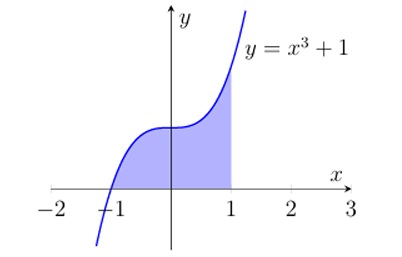
The diagram shows the graph of the cubic function \(y=x^3+1\). Find the area of the shaded region.
Log in to check answers and record progress.
Antiderivative. Rules of integration. Definite integral. Area of a curvilinear trapezoid
Difficulty: ★★☆
1837
The diagram shows the graph of the quadratic function \(y=6-x^2\). Find the area of the shaded region.
Log in to check answers and record progress.
Antiderivative. Rules of integration. Definite integral. Area of a curvilinear trapezoid
Difficulty: ★★☆
1838
The diagram shows the graph of the quadratic function \(y=x^2-x\). Find the area of the shaded region.
Log in to check answers and record progress.
Antiderivative. Rules of integration. Definite integral. Area of a curvilinear trapezoid
Difficulty: ★★☆
1839
The diagram shows the graph of the cubic function \(y=-x^3+2\). Find the area of the shaded region.
Log in to check answers and record progress.
Antiderivative. Rules of integration. Definite integral. Area of a curvilinear trapezoid
Difficulty: ★★☆
1840
The diagram shows the graph of the quadratic function \(y=7-x^2\). Find the area of the shaded region.
Log in to check answers and record progress.